Discriminant analysis uses characteristics of a set of objects to classify a collection into classes. In Gaeapas the collection of objects are geological situations, say petroleum systems, that can be split in a class with HC charge and another that has no HC charge. Her the objective is not so much to classify an object (say prospect) to be in one class or the other, but to estimate the probability of class membership, see van der Geer (1972).
We will arbitrarily call the first one class 1 and the other (dry) class 2. Discriminant analysis then uses a number of characteristics (variables), such as SR thickness, TOC, Maturity, etc. to find an equation that in an optimal way distinguishes between the two classes. Such an equation gives the "Discriminant Score".
What happens can be imagined in space. The items in the collection have e.g. 6 characteristics. The values of the variables are distances along 6 dimensions. So in 6-dimensional space each item in the learning (calibration) set can be plotted as a point. Normally class 1 and class 2 points form a more or less overlapping cloud of points. Discriminant analysis finds a one-dimensional line through this space onto which all the points can be projected. If the analysis is successful, most of the class 2 points will be on the left and class 1 on the right, with a mix in the middle. The distances measured along this line are the discriminant scores.
This allows us to form a histogram, or more precisely, a probability density function (pdf) for each class. So far, the reverend Thomas Bayes (1702-1761) has not meddled with this. But now we realize that the classification is not perfect because of the overlap of points and hence of the histograms or pdfs. With help of Bayes we can find a posterior probability of P[HC] that corresponds to a given discriminant score.
The procedure is given in the figure below:
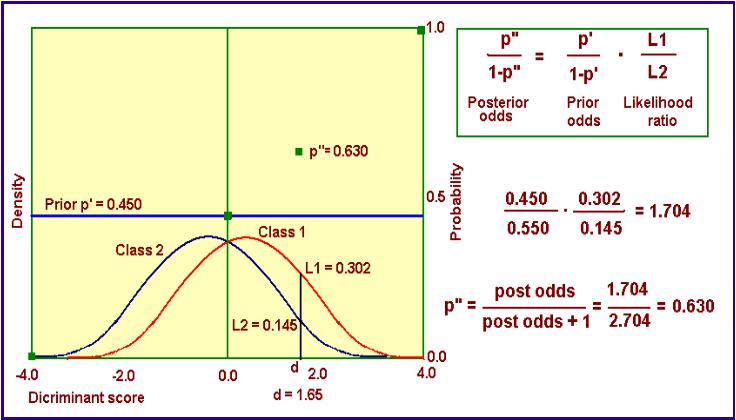
We start off with the local prior P[HC], in this example 0.450 and shown as a horizontal line at height = 0.450. The constant level of this line symbolically means that as yet no information of discriminant scores is used. The latter information is used to update the local prior to a posterior as indicated by the calculations. This involves the concept of "Odds", an old term from gambling. It is a probability divided by (1 minus the probability) i.e. p / ( 1 - p). It comes in handy because the simple Bayes formula applied is in terms of odds. The update also involves the "likelihood ratio", L1/L2. This a ratio of the ordinates to the two pdfs at the position of the discriminant score. As we are somewhat more in the red curve of class 1 that that of two, the L1 > L2. This is good news. The local prior of 0.450 becomes the better posterior 0.630, after conversion of the posterior odds to a probability.
Home
Top