Histogram
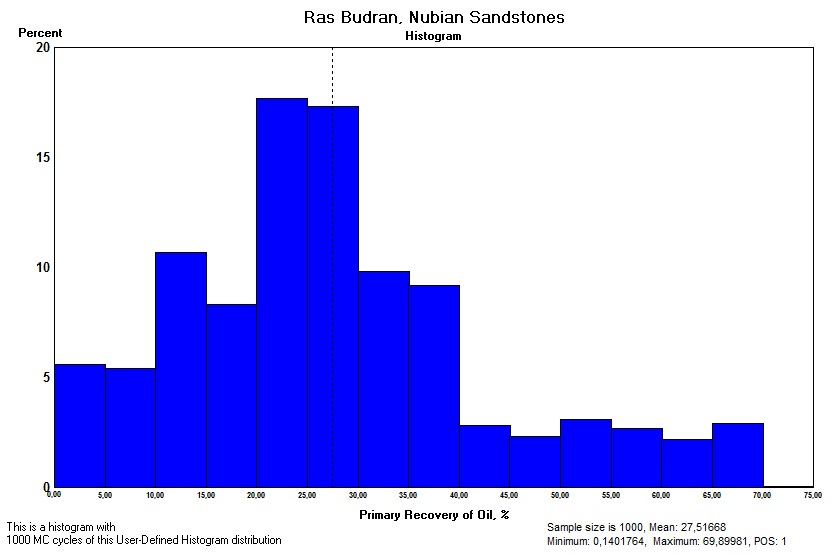
A histogram is a graph showing relative frequencies of the values of a variable in a finite sample. The x-axis is usually a linear scale of the variable, while the Y-axis can be percent (as above), or number frequency. The area under the histogram must be 100% in the case of percent values for the histogram classes, that is the sum of the bar frequencies must be 100%. It is convenient to keep classes of equal width, otherwise the height of the histogram bars have to be adjusted to keep the area to the correct "unity" value, or its equivalence.
To draw a histogram the class sizes (width of the bars) must be decided. Spreadsheets do all this automatically,but you can also decide yourself. Too many classes in relation to the sample size gives a very irregular histogram that could become multimodal unnecessarily. This problem has been studied by statisticians (Scott, 1979) who looked for the ideal binsize. If there is a theoretical distribution, such as the normal, we would have the histogram of the sample depict the underlying theoretical shape as best as possible.
Therefore the suggestion is to let class sizes be according to the following formula:
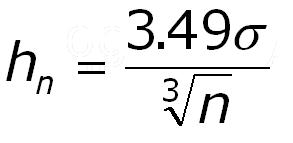
hn is the ideal binsize.
Sigma is the standard deviation calculated from the sample
n is the samplesize.
The formula will give ugly figures, but after rounding to the nearest nice number it works fine. The above example had an hn = 5.42.
The above solution has the disadvantage that the underlying theory is assuming a (more or less) normal distribution. For an unknown density function it is better to use the solution given by Shikamazi & Shinomoto (2007). This involves the computation, for a chosen bin-width "delta", of the mean frequency ("k")in the bins as well as the (biased) variance ("v") of the bin frequencies (which total to the samplesize "n"). Then a function ("C") as follows has to be minimized by trial of different delta values.
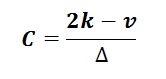
The minimum value of C is negative and near the minimum jumps a little up and down. Therefore I have chosen for calculating all subdivisins of the data range into 2, 3, ...., n/2 trials, and finding the minimum C during these calculations. This procedure works fine, although despite more computation. It gives an informative and smooth histogram, even for a bimodal distribution.