Probability of Success (POS)
- General about POS
- Influence of POS on total uncertainty
General about POS
The probability of success is the ratio of success cases over all outcomes. It is used as "success ratio" of a play or area in which a number of wells have been drilled. In prospect appraisal it is a parameter of the expectation curve, indicating the chance of having more than some minimum. If the minimum volume is zero, we call the probability of success "geological" or probability of "technical success" of finding a hydrocarbon accumulation (POSg). If an agreed economic minimum value ("cutoff") determines what is success, we have a probability of success after cutoff (POSc), which may well be substantially less than the POSg. See the definition of the Mean Success Volume.
Depending on the prospect appraisal method, POS will be estimated in different ways. The most common approach is to take the petroleum system as a basis. The system specifies the necessary geological ingredients (factors) to enable an oil, or gas field to be formed, in particular, these required factors are defined as independent. The usual factors are source, maturity, migration, trap and seal. Estimates of the POS of these factors can then be multiplied to give the POS of the prospect, or play. If the factors were not independent, this simple procedure would be incorrect.
While most of the time a multiplication of probabilities is required, sometimes the average of probabilities is meaningful. For instance: having evaluated a number of prospects in a play and we would like to guess what the mean number fo successes would be in case all prospects are drilled, we multiply the number of prospects with the mean of the POS's. This is the mean of a set of binomial distributions, one for each prospect (see also the page on hindsight analysis).
In some reports the abbreviation "CoS" is used, meaning "Chance of Success". Most likely this refers to our geological POSg, as in many companies the economic cutoff is neglected, or included in some less transparent way. But the term "COCS" or "Chance of Commercial Success" is in most cases equivalent to my POSc. Note that our POSg is by some expressed as "Pg" and its complement: Probability of Failure as "Pf". Another abbreviation is "POD", or Probability Of Discovery.
Unfortunately many people use the word "Risk" for different things. One would logically regard risk as the probability of failure, or 1 - POS. But often POS is meant when using "Risk", i.e. the complement. Also risk sometimes refers simply to "uncertainty" as in "risk curve" for the expectation curve.
Frequentistic, or "classic" statisticians tend to regard a situation of complete ignorance as representing a POS of 0.5, as there is no evidence that an event is more likely to happen than not. This would be a prior probability. In our subjective effort of estimating chances, this complete ignorance is difficult to maintain. The geological experience is almost always present and suggests an a priory POS rather different from 0.5. A reasoning such as proposed by Duff & Hall, 1996, that the a priori probability is 0.5, would be fine if really no information. But then they suggest that much information will increase the POS, and poor information would decrease it!. Logic dictates that the amount of information has no bearing on the POS, but only on the "confidence" that our estimate is well founded. The confidence is actually the inverse of the variance of the POS estimate. Poor information associates a large standard deviation with our POS estimate, but not with the mean of the POS estimate (distribution). See also the page on the beta distribution, where the a priori probability of having HC charge is discussed.
Although POS is usually regarded as a "point estimate", a single number, it is in a few cases reasonable to consider the uncertainty of this number. There is theoretically a distribution of POS. In the case of statistical updating of a probability, the POS has a beta distribution.
Estimates of POS are based on limited information. The effect of additional, new information on the POS is discussed under Probability.
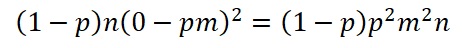
and the contribution from the success cases, S :
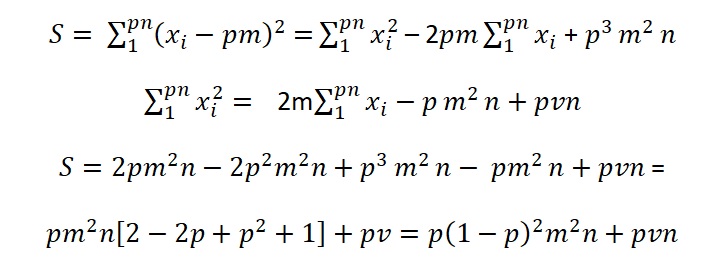
The total variance is, after dividing the total of above sums of squares by n:

It is interesting to see that the maximum contribution as a function of p by taking the diffrentiation
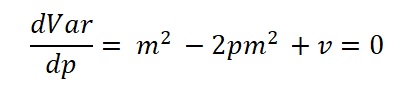
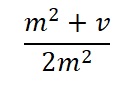
Hence the maximum Var is at the p value:
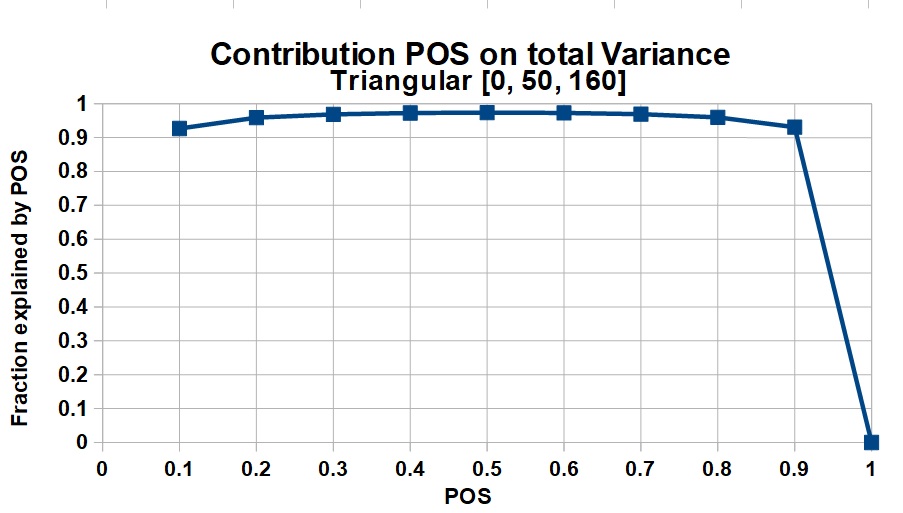
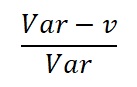
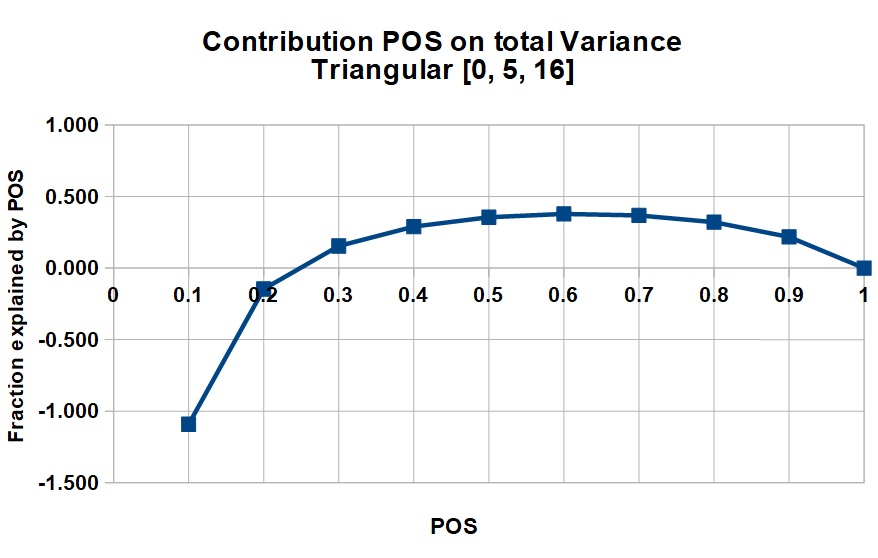
The proportion of the variance Var explained by the POS p is:
The uncertainty of the non-zero volumes in oil and gas prospects is usually a skewed distribution, due to a multiplication process of several variables. In such (quasi) lognormal distributions the variance is a function of the mean, unlike a normal distribution. So, for a larger prospect, the variance v tends to be larger, but the total variance will be much influenced by the square of the mean volume, or MSV. This increases the proportion of the variance explained by POS with increasing mean. Note that in certain cases the contribution of ther POS is negative, but it appears that in the majority of cases the pos is a large contributor to the total variance, suggesting that much attention should be given to make the best POS estimate possible, especially near the end of the POS scale.
As an example of the relative contribution of POS to the total uncertainty, we mimic a realistic distribution of success cases by a triangular distribution for several sizes of mean success.
1) Low = 0, Median = 5, High = 16
Mean = 7, variance v = 11.166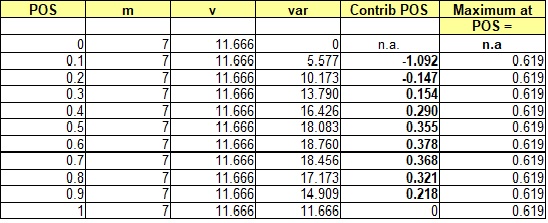
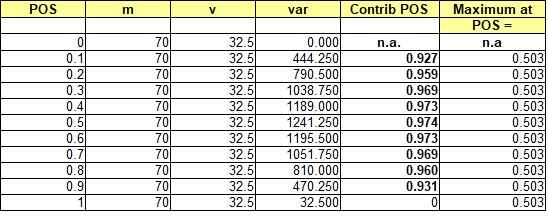
2) Low = 0, Median = 50, High = 160
Mean = 70, variance v = 32.5