The resource assessment methods are applied to the whole world, countries, basins, hydrocarbon provinces, frontier areas and plays. Dependent on the exploration maturity of the area considered, quantitative statistical approaches are possible (Dolton et al., 1984). With less geological knowledge more subjective guesses are made, based on experience. Grace (1997) showed that it may be wise to try different approaches to estimate resources, with an example of Western Siberia. Here we discuss a number of different systems without claiming that we are aware of the total literature on the subject. These examples are mainly aimed at conventional oil and gas. For the resources of shale oil, heavy oil and bitumen we refer to the publication of Meyer, et al., 2007. For unconventional gas resources, which in total may dwarf the total volume of discovered and non-discovered conventional gas, there are many publications. I wrote a now outdated review study on the subject (Nederlof, 1988).
- Fieldsize distribution methods
- Petroleum system estimation
- Logistic curve modeling
- Discovery process modeling.
- Statistical (multivariate) analysis of known mature basins
- Summation of results for the constituant parts
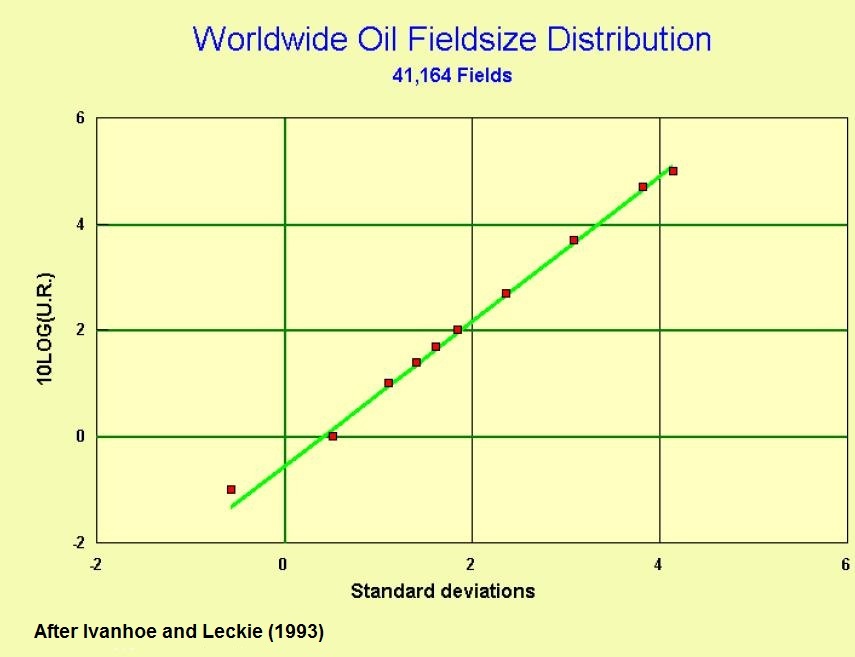
Despite almost endless discussions about the nature of fieldsize distributions, the lognormal is not a bad choice. In a global context we might demonstrate this by showing the data from Ivanhoe, et al.(1993):
Fieldsize distribution Methods for Resource Estimation.
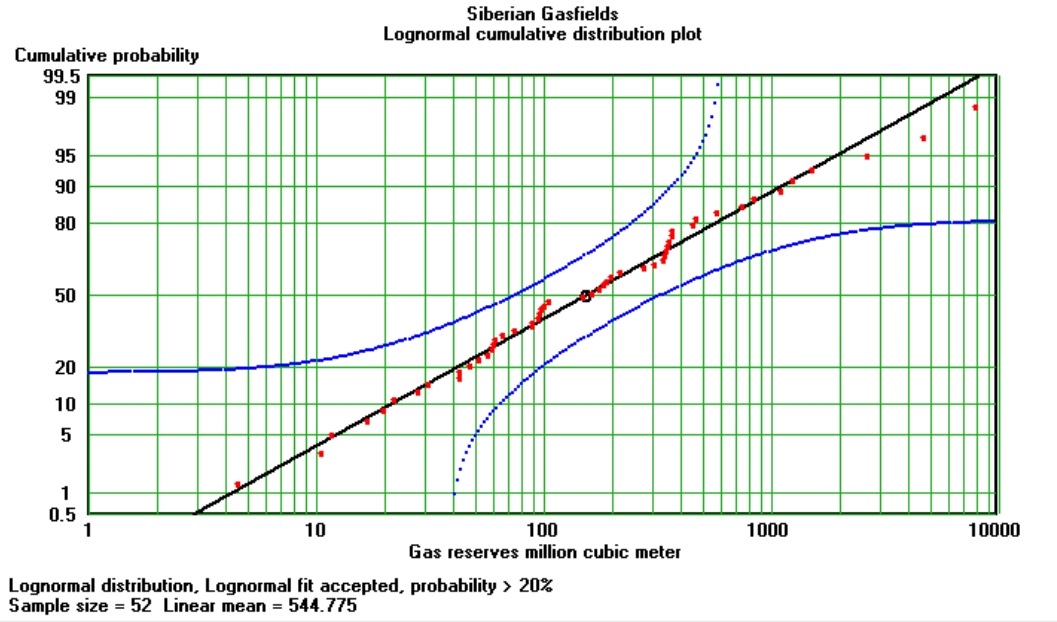
The gas fields of West Siberia also show a good fit to the lognormal:
Stationnary fieldsize distribution
In the days that mainframe computers had a main memory of about a megabyte, the author had to resort to an analytical approach when applying the fieldsize distribution appraisal for the Shell holdings in the Niger Delta in 1964. At that time some 30 discoveries had been made. The fieldsize distribution was very nicely fitting the lognormal. There was as yet no indication of "creaming" i.e. discovery rate and volumes declining with time. Therefore it was decided to extrapolate the observed lognormal to the future prospects. In summary the process was as follows:
- The parameters Mean and Standard deviation of the observed lognormal were calculated. The mean of the log-values corresponds to the geometric mean.
- The standard deviation of the geometric mean established.
- The success ratio was calculated by dividing the total number of discoveries by the total number of exploration wells. The uncertainty of this ratio was calculated with the rules for the binomial distribution.
- The number of undrilled prospects estimated ( more than 100).
- The number of the undrilled prospects multiplied with the success ratio and with the arithmetric mean, derived from the geometric mean and the variance.(See the statistical methods page for details). This results in the expectation of the undiscovered reserves.
- Use the parameters of the previous step to create the parameters of a lognormal distribution of the undiscovered reserves. This allows estimation of the percentiles of the distribution of undiscovered reserves.
- Result: undiscovered Ultimate Recovery with a low (P90) of 9 billion, expectation of 15 billion and a high value (P10) of 26 billion barrels.
This was a daring extrapolation from about 3 billion barrels already discovered and based on such a small sample of fieldsizes. Nevertheless, decades later the results were not very much different from the five times higher estimate described above. However, there were two flaws in this approach, as it happened:
- The fieldsizes were based on the recovery efficiency of the day, on average some 25%, while later it was found that 40% would not be surprising, leading to an underestimate.
- The discovery sizes were not stationnary. Eventually a creaming effect became apparent, which was neglected and hence leading to overestimation in this example.
So, the overestimation happened to neutralize the underestimation. But overall the method proved reasonably sound, although fairly primitive in the light of today's techniques.
Gradual shift of the lognormal fieldsize distribution
This involves two problems:
(1) Some fields are reported but the reserves are only part of the Ultimate Recovery, causing the distribution to be deformed in the left tail. Eventually the reserves, especially of the smaller fields, shift to the right, making the lognormal fit better. Also a large number of smaller fields are not reported at all. Schuenemeyer & Drew, (1983) have proposed a method to estimate the parent population of oil fields that corrects for truncation in the left tail. Their research suggest not a lognormal but a log-geometric distribution.
(2) A creaming effect causes large accumulations to be found early. The more numerous, smaller discoveries later cause the distribution to shift to the right as a whole.(Kaufman, 1992).
These effects can be quantified and help in estimating the undiscovered and ultimate resource.