CTRM screenshots
Compensated Time Ratio Method
Compensated Time Ratio Method
A method to estimate true formation temperature from bottomhole measurements during logging.
CTRM -- Theory
When a well is drilled, the hole is kept clean of cuttings and the bit is lubricated and cooled by the drilling mud. In the beginning the mud is at the ambient surface temperature, but during the drilling of the well the mud that comes out of the hole has accumulated heat from the penetrated formations. So even the mud going into the hole will have on average a higher temperature than the air temperature, and, even higher than the formation temperature of the shallowest formations. At deeper levels than a certain pivot point, the mud will actually be cooling the formations. The extent to which the formations will cool depends on the difference between mud and true formation temperature (TFT), the pump rate and the heat conductivity of the formation and the borehole size.
Although the physical process of cooling is well understood, in practice it will not be possible to obtain all the measurements required for estimating the true formation temperature from the limited data that are usually available. This data normally consists of a set of Bottom Hole Temperatures (BHT) that are obtained by lowering a maximum thermometer attached to the logging sonde. With each log another BHT is measured at approximately the same depth. What happens in drilling practice is the following: Drilling is stopped at the logging depth. The mud is circulated for a number of hours to make sure the hole is in a good condition for the wireline logging, or other operations. This circulation causes a further cooling, i.e. an extension of the cooling period that was due to the preceding drilling. But as we are interested in the temperatures at the bottom of the hole, this drilling of the last 10 or 20 meters will add some cooling time for that bottom interval, but the circulation may be the most important cooling. This duration of cooling is called CIRC and expressed in hours. Data on the log heading may give information from which CIRC can be obtained. This may sometimes be difficult. Therefore a reasonable default value of 5 hours is used in this program.
When the logs measurements are taken, no circulation is taking place. This means that the formation temperature is slowly restoring to normal, and hence also the mud in the borehole at the bottom of the hole is warming up. For a sequence of logs (and hence of BHTs), the heating up of the mud is apparent from the sequence of BHTs and can be related to the time lapsed after circulation ended. The time at which the logging sonde reached the bottom should be found on the log headings, as well as the BHT. So time when sonde reached bottom minus time circulation ended is "HRS".
The warming up is an exponential process that at infinite HRS approches the true formation temperature (TFT). Measurements in closed-in wells have shown that "infinite" time may in practice be as much as twenty days or a month. So a mathematical extrapolation to infinity is more practical. The method is as follows:
Let BHT be a temperature measurement at a given depth. Let HRS be the time in hours elapsed since the end of circulation of the borehole (the warming up period). Let CIRC be the duration of the circulation in hours (the cooling period). Then dimensionless time is defined as:

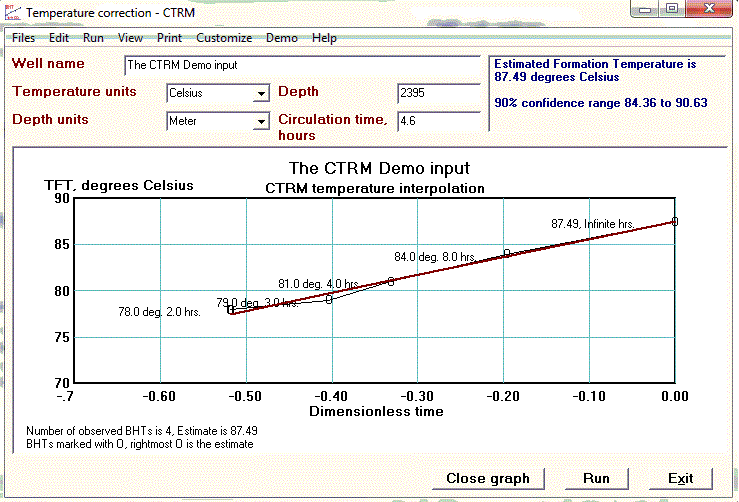
A plot of the BHT's versus the logarithm of dimensionless time gives usually a straight line sloping up toward the right. Note that the logarithms are taken from numbers smaller than 1 and hence are negative. Extrapolating a fitted regression line toward the right gives the TFT at Log(1)=0, corresponding to HRS = infinite. This is because:

Uncertainty of the estimate is given by the standard error of estimate derived from the regression analysis in first instance. But a better approach is to estimate the 5% two-sided confidence limits, as carried out by the program. These limits take all the uncertainties into account, except those introduced by inaccurate BHT readings, HRS and CIRC estimates. It should be noted that when the lower 5% confidence limit is less than the maximum BHT observed it is simply set to this logical minimum limit by the program.
Example:
In a USA Gulf Coast well three logs were run to 16200' depth after 3.5 hours of circulation:
| Log: | BHT (degrees F) | Time since circulation (hrs) |
|---|---|---|
| Resistivity | 241 | 8.15 |
| Density | 257 | 11.00 |
| Sonic | 262 | 13.30 |
The extrapolation gives 297 degrees F for the TFT. Note that the geothermal gradient, assuming a surface temperature of 75 F, would be 1.02 F/100' if the BHT would be taken from the resistivity log, but 1.37 F/100' based on the TFT, about 35% higher! As the geothermal gradient plays an important part in estimating vitrinite reflectance (source rock maturity indicator) it is very important to correct the BHTs with this program.
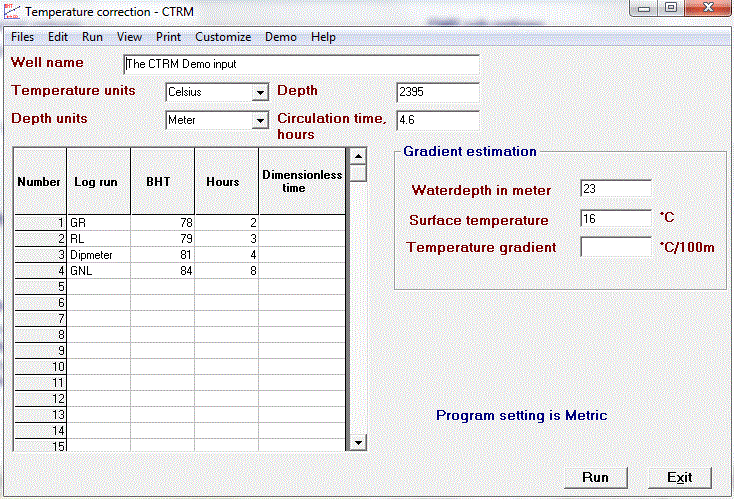
The input screen

Demo input

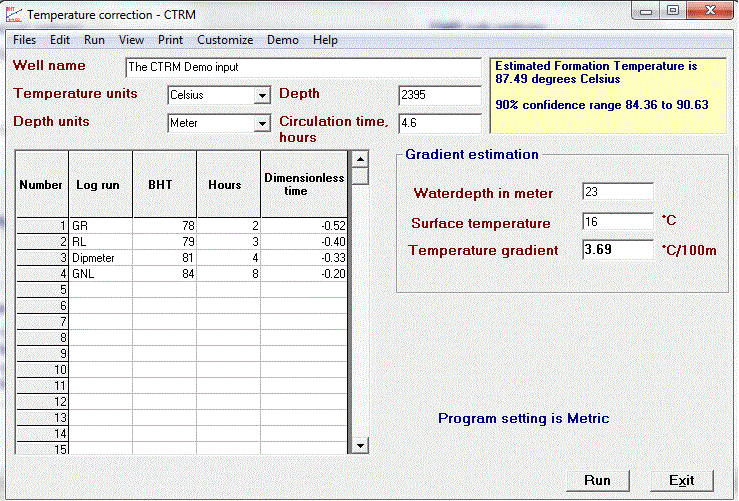
Calculation made. Note the result in the upper right, with approximate confidence limits.

Graphical representation of the method for the demo data.