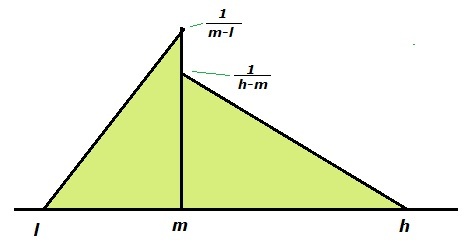
Double-triangular Distribution ("DT")
Is the combination of two triangles, each with an area of 0.5. The mode is also the median. if the DT is used for estimating project cost in an engineering context, it is also possible to assign a probability of cost "overrun". If that is estimated to be e.g. 60%, then the left triangle has only 40% of the area, and the mode is then the "best estimate of cost" and not equal to the median, and the formulas below do not apply. However, AACE, 2008, consider a good estimate of cost to have equal probability to overrun and underrun. So, the mode is the median.
The probability density is:
And the cumulative distribution function:
The mean and variance can be derived in several ways:
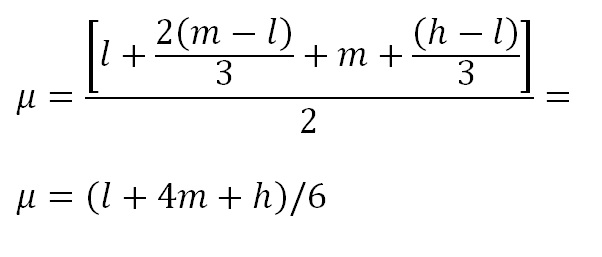
Although the mean can be obtained from maximum likelihood, or the first moment of the distribution, we show the derivation of the mean by centres of gravity, which shows in a way, the geometric meaning of the mean:
The projection of the centre of gravity on the x-axis of the left triangle lies at two-thirds of the (m – l) from l and similarly for the right triangle at one third of (h – l ) from m . As the two triangles have the same weight of ˝, the centre of gravity for the DT lies at the average of the two centres of gravity:
Hence the mean is:
As a matter of interest, the variance is derived by the method of moments:
The mean is denoted below as μ
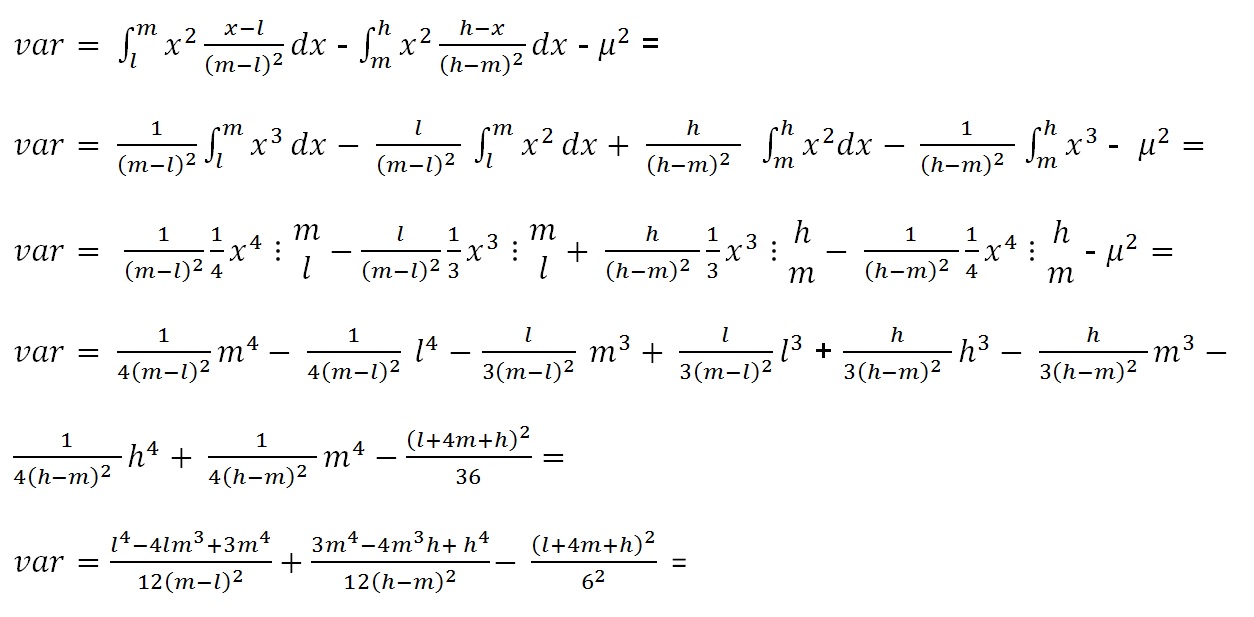
Unfortunately a most unelegant result, which can not be simpliefied, even when bringing all to a single divisor.
Note that on the internet one can find (h - l)/6 as the standard deviation of the DT. This is incorrect for the DT as defined here, and results in a too low st. dev. and variance.
For Monte Carlo simulation random values from the DT can be generated using random numbers between 0 and 1 (here denoted as "p") and the following formulas:
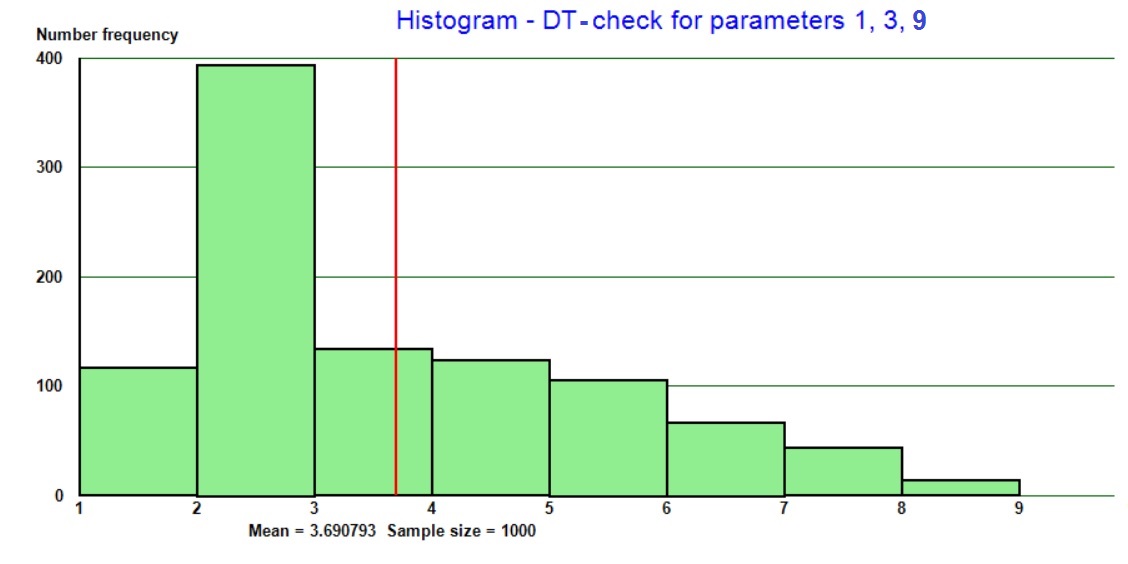
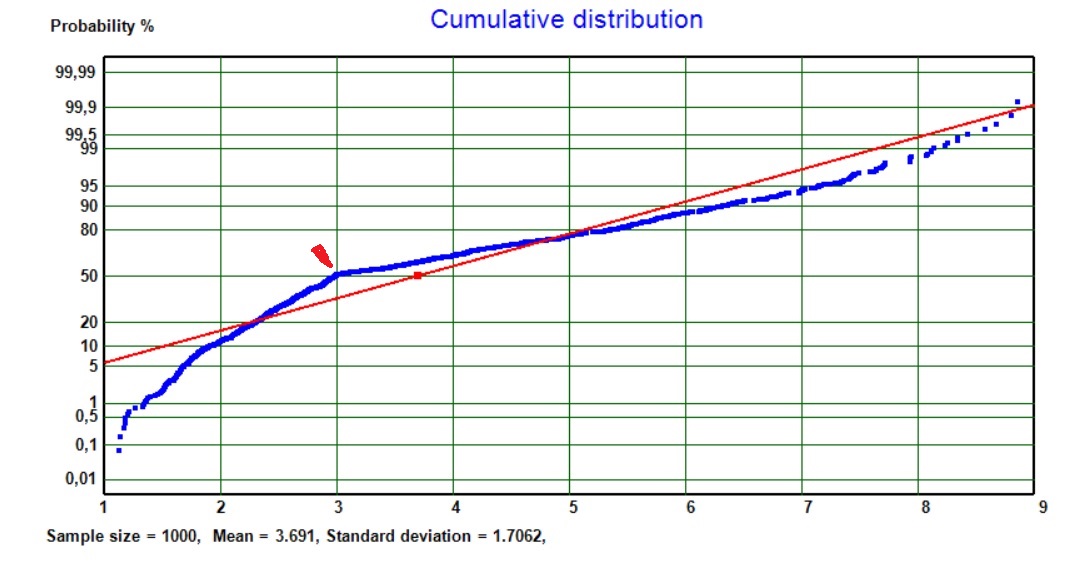
An unpleasant characteristic of the DT, in the general case, is the ugly discontinuity at the median. An example is shown below for the case l = 1, m = 3 and h = 9 as a MC result histogram and probability plot.
I think that the double-triangular is quite unnatural, at least in the context of estimating variable values in prospect appraisal. It is highly unlikely to be a proper representation of uncertainty. Moreover, estimating the median is, in my view, more difficult to estimate than the most likely value (mode).
Revised 24 - 04- 2018