The Petroleum System - an overview
From the above scheme it is clear that at least 25 different elements play a role in assessing a prospect, or basin. Also the petroleum system forms a chain. If the chain misses a link, the prospect is doomed. The five main elements are essential to make a viable prospect. They are in principle totally independent factors, although, for instance "timing" plays a role in several of the basic processes, and is, in a way, the fourth dimension. The independence of factors is important because an overall probability of success can then be obtained by simply multiplying the individual probabilities of the elements being successful.
Generation, as we describe it here, is biotic, thermal generation: the burial of sediments with organic meterial which undergo a "maturation" process which decomposes kerogens of various types into oil and gas. This in contrast to bacterial origin,
or abiotic origin.
Before the 60ies of the past century, it was believed that oil was formed out of dispersed organic material in shale by bacterial processes and at low levels of TOC. But in 1965 Philippi working in Shell Oil published the important paper "On the depth, time and mechanism of petroleum generation.", in which he argued that only with sufficient temperature and richness of organic material oil could be generated. He also pointed out that vertical migration plays an important part explaining oil in shallow reservoirs. In a nutshell, this is the quint essence of the petroleum system! Within Shell his ideas were known years before the publication. It was an eye opener to us and I used these ideas to study the petroleum system in the eastern flanks of the Andes in Bolivia in 1961.
Although oil and gas generation is going on in most sedimentary basins today, the amounts and speed of this process is such that we can not replenish the HC accumulations fast enough by "current generation". So oil and gas are for all practical purposes a finite resource.
In the following we will sometimes refer to "source rock" as "SR".
In the Indonesian basins methane is also found fom biogenic and thermogenic origin. Mixtures occur also, inferred from the isotope composition (Satayana et al., 2007).
An excellent presentation on the isotope chemistry of gas is available from Burruss et al. (2009), see also the classic Schoel, M, (1979 and 1983).
The relation of the carbon isotope ratios to maturity of the source rock is also discussed by James (1983).
A discussion of biogenic gas at shallow depth in organic-rich shales is given in Cokar (2010). This discussion will concentrate on "classic" source rocks.
The main types of source rocks are indicated by Roman characters I, II and III. The classification is based on the content of hydrogen (H), carbon (C) and oxygen (O) in the "van Krevelen diagram". As generation proceeds the atomic ratios change gradually as H and O are demnishing in relation to C, a process of coalification. Near the origin of the graph the organic material turns into graphite, pure carbon ( Welte, 1978 and Waples, 1981).
Generation
Source rock type
In general, a distinct oil/gas source rock is necessary for generation of oil and gas. For natural gas, mainly CH4, there are more possibilities. In some cases a biochemical process generates "biogenic gas" from dispersed decaying organic material at temperatures that would not be sufficient for themogenic generation. Then the source is difficult to pinpoint. Think of marsh gas and of the vast resources of gas hydrates under the sea bottom. To distinguish a biogenic gas from thermogenic gas, isotope composition of CH4, such as the δ13C and the ratio of C1/(C2 + C3) gives a good indication. Biogenic gas has usually a δ13C of more positive than -50 and the C1/(C2 + C3) > 100. Thermogenic gas has a δ13C less than -50; There is a difference between the isotope ratios in higher alkanes of the same source or process while also different types of source rock have different isotope compositions. 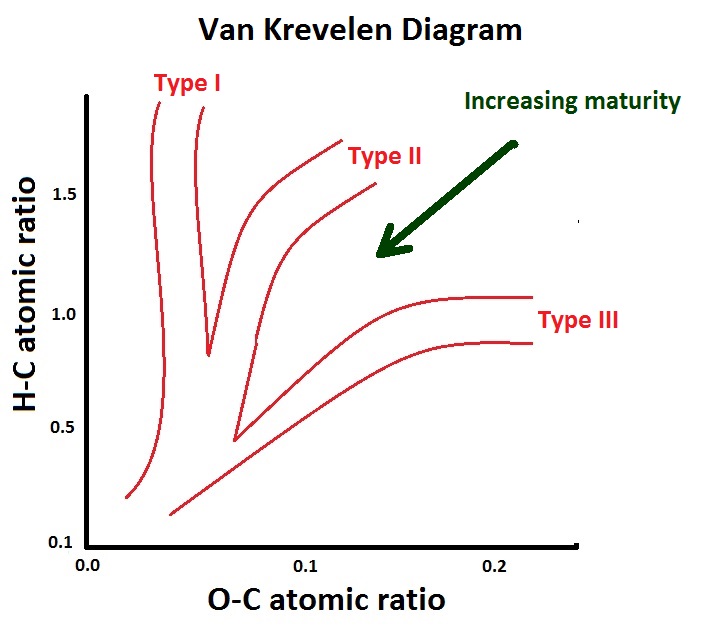
Type I has mainly algal/sapropelic kerogen and is often associated with anoxic environments in lake sediments. Type II has lipid-rich kerogen from planktonic origin and mainly associated with marine sediments. Type III has humic kerogen derived from plant material. Most coals are type III source rocks (Wilkins & George, 2002). Type I and II are generally oil-prone while type III is mainly a gas source rock. The Westphalian coal measures (Lower Carboniferous) in the dutch subsurface have generated enormous quantities of gas: the Groningen gas field. Note that the nature of humic source rocks has evolved with the evolution of plants. Many maturity.
Production of organic matter, whether on land or in the sea or lakes, is dependent on the environment, in particular temperature. Therefore paleoclimate studies have a bearing on the probability that a given formation may contain source rocks. Warm periods in many parts of the globe during the Mesozoic have given rise to famous prolific rocks, such as the Hanifa Fm in the Middle East, and the Posidonian Schiefer in western Europe. Special publication No 40. of the AAPG (1992) contains various discussions of this relationship, see also Rodriguez et al., 2012.
Basin analysis and a knowledge of plate tectonics are helpful in rather unkown territory to assess the likelihood of SR presence. For instance collisions of oceanic crust on oceanic crust in the Philippines are not conducive to the right environments. Better is continental crust against continental crust, or against oceanic plates. The rifting stage is a favourable episode for SR's. A pertinent discussion is given in Doust and Sumner, 2007. One favourable environment for SR is the delta. The Niger delta, Mississippi and several deltas in Indonesia are prolific oil provinces. If we want to connect SR in deltaic sequences with the oil accumulations, we would have to drill very deep. Most information is from the immature depth zone, where the accumulations are. The samples are immature analogues of what we expect to be the sources at greater depth.
Basin or province analysis often deals with quantitative data on maps. From this data conclusions can be drawn about trends assisting predictions at undrilled sites. Many geologists will be happy to draw contours and detect trends by "eyeballing". However analysis of mapped data can benefit well from two techniques:
- Residual analysis.
As many data, such as porosity, oil API, etc. are correlated with depth, it is useful to make a simple linear regression of the data versus depth. Then make a new map where the residuals are plotted. Assume that the porosity data from a particular formation are at various depths, the residual map could separate the compaction effect from facies trends. However, in the bad luck case, the "facies map" (residuals, or "anomalies") may, of course, be just noise . Note that this kind of analysis is very similar to what is done with gravity maps in geophysics. - Variogram analysis and kriging
This a technique widely used in reservoir engineering and seismic interpretation. The variogram gives an indication of the correlation between, say a porosity value at point A and at point B at a distance of h kilometers. If the data show two-dimensional autocorrelation, this shows up on a variogram. Do not try to contour data of which the variogram says there is no relationship between data points. Nevertheless, most explorationists feel the temptation to contour almost anything.
Back to generation
Source rocks contain carbon, but part of this may be in CaCO3 or similar minerals. TOC is the weight percent of organic matter after removal of the carbon containing minerals. Very high TOC is found in coals, of course, but in the usual Type I and II SR's the content is a few percent. To qualify as a sourcerock it should contain at least 1.5% TOC according to most geochemists. The reason is the expulsion capacity. If there is very little organic material in the rock, it is likely to be in unconnected particles and any movable HC formed may not be sufficient to break away from the organic material they are adsorbed to "Primary migration" (out of the SR) can only begin at the moment that sufficient HC are in the pore, or fracture system within the source rock.
Total Organic Carbon
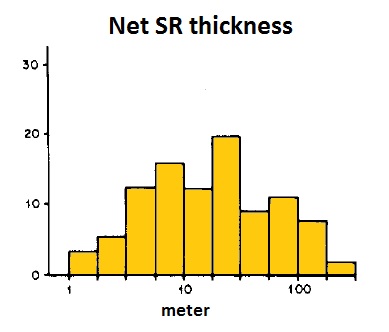
For a quantitative calculation of the HC volume generated we need the TOC and the "net thickness" of the SR which excludes the layers with < 1.5%. Net thicknesses of SR world-wide vary considerably. A world-wide sample of oil source rocks shows the pattern as given in the following histogram with a logarithmic scale.
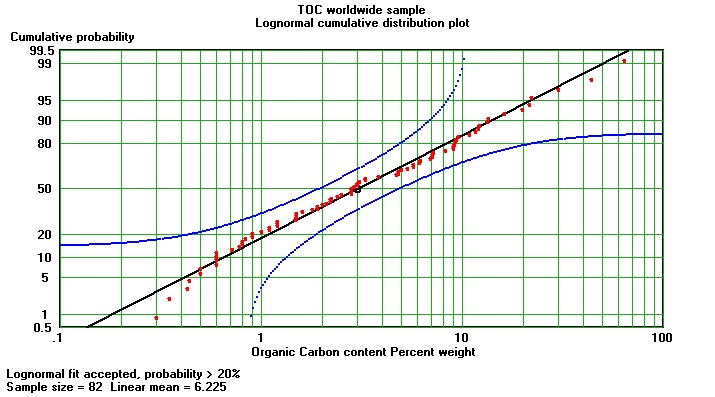
A similar lognormal distribution applies to TOC measurements in a borehole. Such data come from e.g. sidewall samples or cores, but also from a petrophysical analysis. Already in 1967 Tixier & Curtis used well logs to estimate oil yield from well logs. Schmoker (1979, 1981) tried to estimate TOC inn Devonian shales, by density log or gamma ray logs. In the early 1980ies, I tried to spot source rocks on a combination of the sonic and resistivity logs. Also the combination of density and resistivity proved useful, although the density log suffered much from borehole roughness. This led first to a nomogram to help the screening of a set of logs, suggesting SR or non-SR only (Meyer & Nederlof, 1984). Then when more calibration data became available, a TOC estimation on the basis of a regression analysis became possible. After 1984, many papers addressed the petrophysical possibilities further (Carpentier et al. 1990, Passay, 1990).
The theoretical basis for the petrophysical TOC estimation is described separately. A world-wide survey of source rocks shows a lognormal distribution of average TOC value with a mean of about 7%, but In this sample coals are under-represented, otherwise there would be many more samples in the 50 to 100% toc range.
When sulphur occurs in kerogen, it often forms a link between the complicated compounds which are the precursors of oil or gas. Most of the sulphur is organically bound and during maturation causes H2S generation and, given the presence of iron, forms pyrite. The chemical sulphur bonds are more easy to break under the influence of rising temperature that C-C bonds. Sulphur facilitates the transformation of kerogen to oil (Baskin & Peters, 1992, Armani, 2012, Lewan, 1998). It is also proposed that the sulphur radicals, generated at an early stage of maturation play an important role in the kerogen and bitumen conversion. Hydrous pyrolysis experiments have indicated that the presence of sulphur could lower the maturity level for first generation, compared to sulphur-poor SRs. A prospect model must take this into account when modeling the rate of transformation.
The yield refers to the amount of oil, or gas, that can be generated from a cubic meter of source rock, per percent TOC, given that the rock passes from an immature state to overmature. A practical term is PUYO in liter/m3/%TOC or "Potential Ultimate Yield of Oil" and PUYG, in m3/m3/%TOC or "Potential Ultimate Yield of Gas". Here "Oil" includes any condensate.
Sulphur
Ultimate yield
| Sluyk Nederlof code | Tissot/Welte | Description | PUYO | PUYG |
|---|---|---|---|---|
| HH | III | Humic | 0.0 | 1.2 |
| MH | ± III | Mainly Humic/Humic | 3.7 | 1.6 |
| MM | ± II/III | Mixed | 6.6 | 1.9 |
| MK | ± I/III | Mainly kerogenous | 10.9 | 2.1 |
| K+ | II | Kerogenous/bacterial | 13.8 | 2.2 |
| KK | I/II | Kerogenous/algal | 19.6 | 2.6 |
The PUYO and PUYG has been estimated from research in Shell in the 1970ies and can be disputed. However, for PUYG a more recent study using kinetic models and hydrous pyrolysis results give similar quantities of gas (Henry & Lewis, 2001).
Maturity
Under the influence of temperature, pressure and time, the kerogen in source rocks is transformed, broken down into smaller molecules and finally into oil and gas. To estimate when and how much transformation has taken place (transformation ratio), measures of maturity are used. One popular measure is the Vitrinite reflection (VR). Vitrinite particles are studied under the microscope and the reflexion of light is compared to a standard, expressed as a percentage. It varies roughly from zero to some 5 %. Vitrinite Reflectance measurementrs were originally developed for determining the rank of coal. Recently Hackney et al. (2018) warned for bitumen in a sample that can be mistaken for vitrinite. The effect of that is underestimating the maturity, as bitumen is more slowly reacting to the temperature history.
Another measure is the coloration of pollen, which works for sediments younger than Devonian (Gutjahr, 1966). A similar method based on increasing darker colours at increasing maturity is the CAI, the "Conodont Alteration Index" which is useful in marine sediments from Upper Cambrian to Triassic, Epstein et al. (1977, 2008).
A geochemical measure is the Tmax from Rock-Eval analysis. The Rock-Eval analysis consists of heating a small quantity of SR slowly, although much faster than in the natural prcess of maturation. If the SR is already mature to a certain transformation ratio, the already produced bitumen (and not yet expelled) are detected as a first peak of gas generation by a detector. The volume of HC in this peak is called S1. A second peak is caused by further cracking of the remaining kerogen. The temperature at the peak of this second generation is called Tmax. The volume of HC in this peak is S2. A third peak S3 is associated with CO2 production at still higher temperature. The Tmax of a mature sample will be higher than for an immature sample, as the latter generates an S2 component already at a lower temperature. The Tmax can be a substitute for the vitrinite maturity indicator using, for instance, a regression of VR on Tmax.
The various maturity indicators can be roughly translated from one into the other. Here we will only consider the VR measure.
Apart from measuring VR in subsurface and outcrop samples, it is convenient to have a model to estimate VR in a sourcerock before drilling a prospect. This can be achieved by using the idea put forward by Lopatin (1971) who postulated that the reaction speed of the tranformation of kerogen to oil might well double for each 10 degrees Celsius temperature increase. The modeling can be done by using a geohistory, or burial graph:
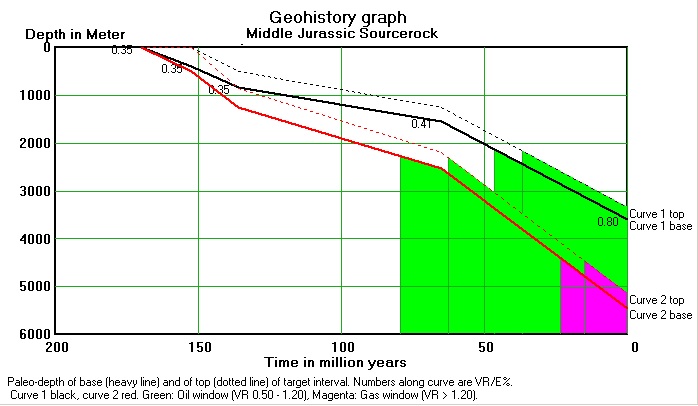
In this graph the VR estimates are indicated. Both the top of the SR interval and bottom are analyzed. In this example two situations are analyzed: one shallow and one in a deep part of the basin. In this way the history of the maturity can be determined, which is required to establish the timing of generation in relation to trap formation. The model producing this graph takes the history of temperature gradient into account, as well as the history of compaction. The present day temperature gradient is often obtained from bottomhole temperature (BHT) in wells. As such measurements are subject to bias because of formation cooling by drilling mud, a correction program can improve the temperature estimate (CTRM). Needed are three or more BHT measurements at the same depth during the logging process, as well as circulation time and the time since circulation for the BHT's. Then an extrapolation of the BHTs to the true formation temperature becomes possible:
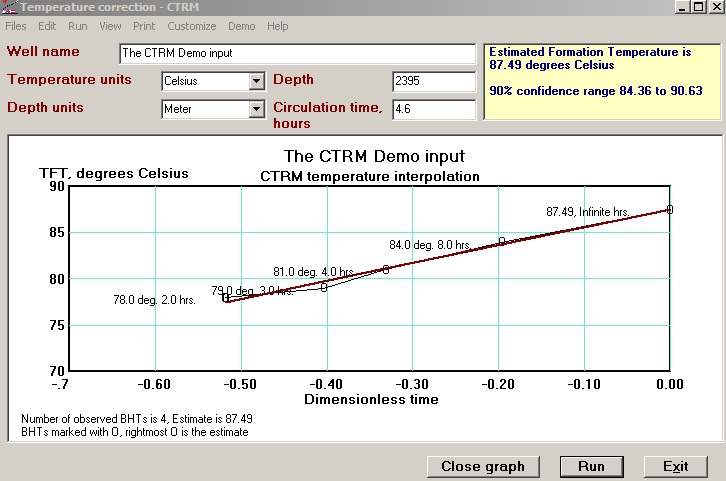
Unfortunately, in many cases not enough different logging runs are available to use the CTRM method. Or the thermometer that went down the hole was not reset. In such cases a statistical correction can be attemmpted, provided that quite a few other well data are available in the same area (cf. an example from Tunisia, Bouaziz, et al., 2015).
The temperature gradient is calculated as (Formation T - Surface T) / depth. But in a lake or offshore, the water-bottom temperature is used instead of surface, so the gradient becomes: (Formation T - Waterbottom T) / (Depth from water surface - Waterdepth). A reasonable world average is 3 degrees centigrade per 100 m.
Heatflow is inversely proportional with the temperature gradient in a given lithology. Heat traveling from depth to surface therefore will vary per formation. In the Niger delta this is clearly seen in a section of alternating shales and sands in the Niger delta:
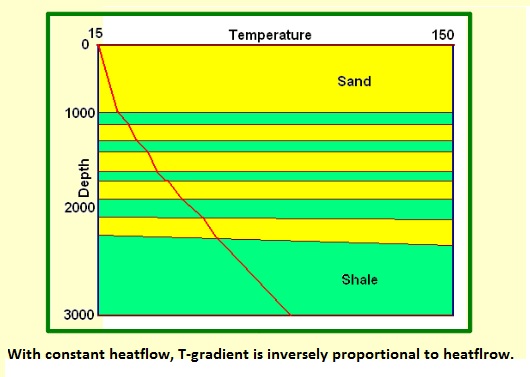
In the Niger delta heat transfer is not only by conduction. In the one to two Km of extremely porous sands in the uppermost section, convection currents are probably causing the exceptionally low T-gradient.
For the geohistory or burial graph, it is sometimes necessary to estimate any removed sections which represent periods of erosion, or "exhumation". Removed overburden is usually estimated by resort to the sonic log. This gives a compaction curve for clays and mudstones in a continuous stratigraphic section. As compaction is almost entirely irreversible, the sonic log can give an indication of the thickness of the missing stratigraphic section, provided there is enough data above and below the hiatus. A very good study is that by Tassone et al. (2014)for the Otway basin in Australia. I have made a program to restore the thickness of a section with a hiatus.
The Lopatin system calculates the "TTI" the Temperature-Time Index. Each reaction speed in an interval of a ten degrees (degrees Celsius) warming is multiplied with the duration in million years. All interval results are summed to the TTI. Waples (1981) has given a table to convert the TTI into a VR estimate.
Far more sophisticated methods are available, involving calculations of heat flow and modeling with activation energy, which is well described in Häntschel & Kauerauf (2009).
At very high maturity, coal source rocks will turn into anthracite, while the more H-rich source rocks of type I and II will eventually turn into a graphite-like product. Some of the polycyclic aromatics may become diamondoids, cage structures of carbon. These may be encountered as biomarkers in oil and condensate. With regard to gas, isotope analysis can indicate the origin of e.g. methane. Important is the content of Deuterium 2H and of 13C. Recently "isotope clumps" such as 13CH3D, give indications of the temperature of formation and the type of genesis (Schoell, 1983).
Back to generation `
The value of gas accumulations is dependent on the calorific value of the gas. If the gas is mixed with non-hydrocarbon gas, such as N2, CO2 the value is reduced. The Groningen gas (Netherlands), for instance, has 15% non-hydrocarbon gas, of which 14.2% is N2, the rest CO2 and Argon. As most of the Dutch domestic use is adjusted to the calorific value of this mixture, changing to higher, or lower calorific gas from other sources would be a costly affair.
The origin of the "unwanted" gas types is not too well known, but in some cases it can be attributed to the heating of carbonates in the subsurface or mantle degassing for CO2, and, of course, by cracking of an oil deposit at high temperature. Nitrogen could be generated when coals are highly overmature. A component of cracked oil that can help in determining the state of cracking of oils is the diamondoid family of cage-like carbon structures.(Ye Wang,(2014). A quite different origin of CO2 (and CH4) is described from Siberian gas fields. There the isotope evidence and the occurrence of biodegraded oils suggest that the biodegradation process can yield significant amounts of methane and carbon dioxide (Milkov,2010).
Non-hydrocarbon gas
Thermochemical sulfate reduction can also be the result of an oil deposit buried to great depth. A good example is a Triassic field in NE Sechuan Basin in China (Lei Jiang,2014), where an oil accumulation was buried to 7 Kilometers depth end suffered temperatures betwee 116 to 220 degrees C. First the ol was displaced by gas, the sulphur in the oil into elemental sulphur and H2S.
A good overview is given by Weatherford (2016?).
Original TOC
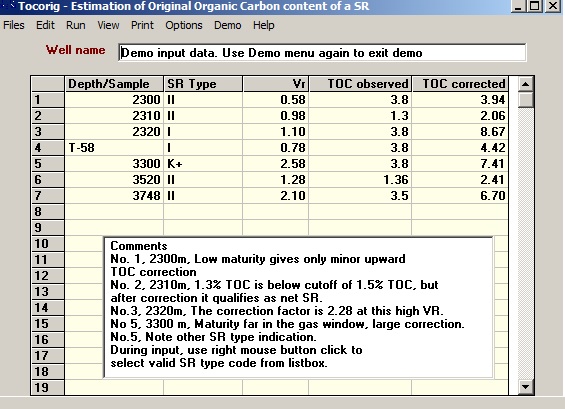
It is quite rare to have a complete suite of SR samples representing the whole range from immature to overmature. If samples are available somewhere in the VR 0.5 to 1.2 range, it is necessary to correct the observed TOC to what it must have been in the immature state. The logic behind the correction involves several assumption, such as the density of the dry SR and weight of the organic matter. A small program has been written TOCORIG to do the calculations. A few examples:
Drainage, Fetch, or Gathering area
A geometric drainage area is defined as a region of SR that has possibly provided oil/gas to an accumulation. Assuming that migration will normally go updip through some carrier bed, arrows can be drawn around a prospect to determine the area from which the HC would expected to migrate to the trap. If the present day map at SR level is valid for the time of generation and migration, the drainage area is limited by the synclinal axes that surround the trap. More important is the effective drainage area, which is limited to the sub-area of the geometric drainage area where the SR has reached maturity (VR > 0.5, say). As the geometry at the top reservoir level may differ from that at SR level, it is also useful draw a drainage area at that level. The following is an example of a drainage area of the the Ras Budran field in Egypt. The exploration well is marked as E55 near the culmination of the structure. The red interrupted line is the drainage area boundary. Interrupted contours are lines of equal maturity in VR units. In this example all the SR within the drainage is mature (>0.55), hence the drainage is "effective drainage area". The best area in the NW reaches VR=0.82, but is small and most of this drainage area is just in the beginning of the oil window. Nevertheless, SR thickness and the 100 Km2 resulted in a more than 267 million barrel U.R. oilfield.
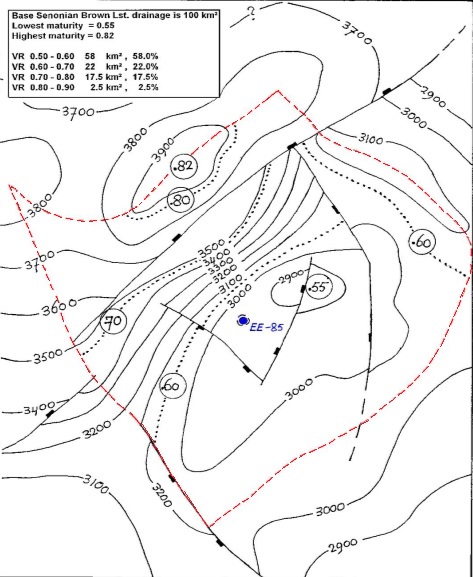
By using the appropriate yield curve, the volumes of mature SR, their VR level and PUYO, an estimate of the expelled oil can be made. Complications arise when several traps are on a monocline. In that situation traps may have to share a drainage area. Smaller traps may receive too much oil for their trap capacity and then overspill occurs. See below in Entrapment.
Timing
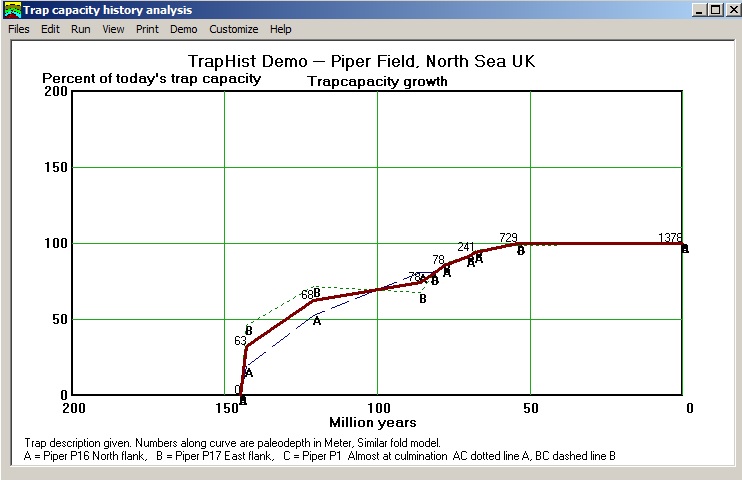
Timing or synchronization is aimed at estimating how much of the oil, or gas has migrated to a trap after the trap was formed. In some cases much oil migrated before the trap formation and went updip, bypassing the trap. So timing involces the geohistory graph, yield curves to obtain the generation history as well as the history of the trap. Some traps have been formed in very short geologic time intervals, others take a long time to form. Examples of the latter are drape structures over basement highs, structures above a salt dome and growth-fault structures. In a simple anticlinal trap, the trap capacity is roughly proportional to the vertical closure. So a history of vertical closure can give an indication of how the trap capacity evolved. A simple comparison of formation tops at a crestal well with a down-flank well, or tops determined from seismic depth sections leads to an estimate of the growth of trap capacity. Here is an example of the growth of the Piper field in the North Sea, assuming an Oxfordian reservoir (Maher et al., 1992).
Migration
Migration consist of two phases: primary and secondary. The primary is the expulsion of oil/gas out of the SR into a carrier bed. The breaking up of kerogen into smaller molecules, mainly hydrocarbons, causes a volume expansion in the SR and overpressure. This process causes microcracks to be formed, which form the pathway for primary migration and has been demonstarted in the laboratory (Ynfei Yang, et al. (2018). See also Stainforth & Reinders(1990) for prijary migration. A process that involves the amount that is available for expulsion, not necessarily equal to the volumr of oil (or gas) formed. The HC formed are in first instance adsorbed in the kerogen. Only when a certain threshold is reached is part of the generated HC available for expulsion. Pepper and Corvi (1985) give a good overview and some data that help to quantify this process.
The secondary migration is the path that oil and gas take to an accumulation. This can be a vertical sense, and /or in a lateral sense. With vertical migration through formation boundaries is meant. Lateral will be following the same carrier bed.
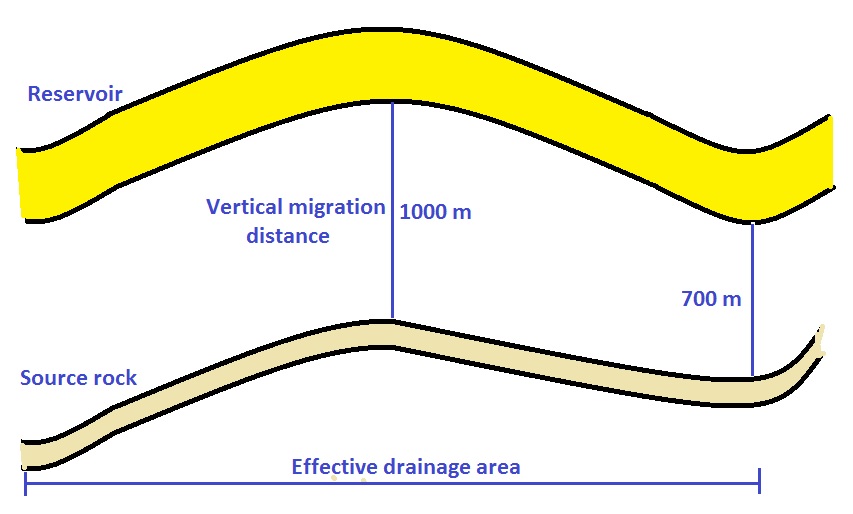
There have been many hypotheses about the migration process. Solution of oil and gas has been considered, solution with the help of natural soap-like substances and bulk migration. The latter is envisaged as a connected flow of liquid, or gas, through porous rocks and it is the most likely mechanism at work. Such flows may reach the trap, but similar to an evolution tree, many branches may end up in a dead-end path before that. Hence some loss of migrated HC from the volume generated is likely to occur. Therefore it appears that both lateral and vertical migration distance in, say, kilometers resp. meters is relevant. The vertical migration distance can be defined as the stratigraphic distance between the top of the SR and the base of the target reservoir in meters. It makes a difference if it is measured form the deepest point in the drainage area or in the shallowest point. In practice a mean value will do.
For vertical migration the lithology of the formations to cross is important and related to their sealing capacity, while faulting and fracturing might turn out to be of positive influence. Such effects, apart from the distance to travel, can be caught in a "migration factor" which is difficult to define quantitatively. In the gaeapas model the quantitative vertical migration factor is based on the results of research of the top seal.
Gas can migrate easier through fine-grained rocks. Free gas, even at low saturation has a large effect on the seismic velocity. Thus vertical gas migration is quite often visible on seismic sections as "gas chmneys" and "vertical anomaly clusters". Because of the relatively lower velocity within the free gas bearing strata, such stacks of anomalies can cause a pull-down on deeper horizons (Foschi, 2014). Normal faults, even those that are not well visible on seismic probably play a role in forming these anomalies.
For lateral migration distance has to be defined in a more complicated way. The principle is that we require the average distance that a drop of oil has to travel along the SR surface to a theoretical "gathering point" underneath the culmination of the trap, but at SR level. If we assume a circular drainage area with radius rand a gathering point in the centre, a theoretical measure can be as the average distance of all points within the circle to the centre:

Note: the result is similar to position of the centre of gravity in a triangle, which is at two-thirds the height from the top.
If the yield from the rim of the drainage area is greater than in the middle, this measure can be adjusted (subjectively) upwards to take this into account. And faults can be a limiting factor, either limiting the path, or deflect migration into another direction, all depending on the fault seal properties. Depending on the tectonic style of the basin, lateral migration distance range from a few hundred meters to several hundreds of Km. A good example of a detailed analysis of migration is given by Kroeger et al., (2009) from the Mackenzie Basin, Canada. Another interesting analysis is given in Shiang Xu(2014). The lateral migration distances reach several tenths of Km. Very large distances are thought to occur in Qatar in the Middle East. Modeling shows a distance of over 100 Km. Also the Orinoco heavy oil belt may be the result of lateral migration from the north over several hundreds of km. The Athabasca bitumen deposits have been sourced from over 800 kilometers (Tozer et al., 2014). See also the many papers presented at the Gussov conference, October 2017 (CSPG, Canada).
Entrapment
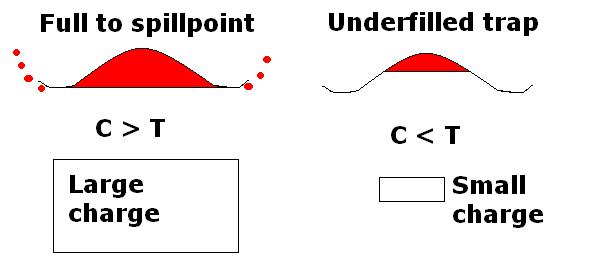
This the process of accumulation. It involves the HC charge and the trap capacity. The charge is the result of geochemical.geological modeling and represents the total volume of oil and gas at subsurface conditions that reached the trap during the accumulation process. Most likely, the speed of accumulation is largely determined by the speed of generation within the drainage area. So, accumulation may take considerable time. The charge is confronted with a volumetric calculation of what the trap can contain in terms of oil and gas, where the reservoir chracteristics and the pressure/volume/temperature (PVT) data are taken into account. There are several possibilities:
Trap capacity in terms of "Bulk Reservoir Volume" is calculated by first making a graph of top reservoir area versus depth. Then depending on the folding style (similar or concentric) the position of the bottom of the reservoir is determined. The area between the two curves is then integrated into a volume (BRV). In a similar style folding, the bottom reservoir curve is exactly the same shape as the top reservoir curve. So a simple translation of the top downwards over the gross thickness of the reservoir ("G") is sufficient. For the concentric style, each point of the top has to be projected over a distance G in a direction perpendicular to the top reservoir surface at that point. Clearly a significantly more complex procedure. Also the concentric might lead to impossible geometric situations in tight folding, the so-called "lack of space".
For a prospect appraisal program we often requure the trap capacity as a function of the depth below the culmination. This is derived by integration of a graph such as the example given here:
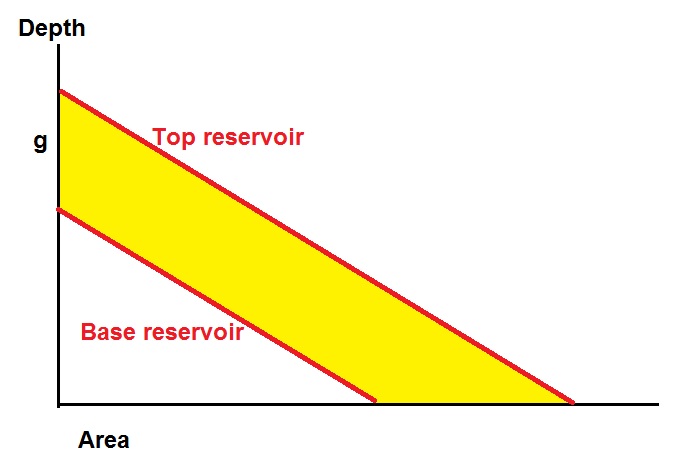
Traps may vary widely if geometrical shape. A small overview of simple traps gives the formulas for the depth/capacity function is some idealized trap shapes. The result is the Bulk Reservoir Volume (BRV). This is a "geometric" trap capacity. The trap capacity for hydrocarbons is a discount of the geometric volume by the porosity, Net-To-Gross and HC sturation factors in the first place. Then we have the pose volume which, in turn is modified by with the help of a number of reservoir engineering formulas. This leads to "Stock tank oil initially in place", or "STOIIP" and "Gas intially in place", or "GIIP". For oil, the volume in the subsurface depends on the temperature, pressure at depth, gas/oil ratio (GOR) and the oil density (e.g. degrees API) at standard surface conditions. From this the Formation Volume Factor (FVF) is derived. For instance, an oil accumulation at 2000 m depth may have a FVF of 1.40. This means that the oil is inflated by the dissoved gas and will "shrink" to 1 / 1.40 = 0.71 when brought to the surface. For gas, the expansion factor is calculated, using the Boyle-Gaylussac law for ideal gas and some corrections for non-ideal gas (z-factor). The volume that gas occupies in the subsurface is roughly proportional to the ratio of absolute temperature over pressure. An expansion factor of 300 means that the subsurface volume of gas will expand 300 times at the surface.
CondensateAs mentioned under generation in discussing the HC yield of a SR, the PUYO includes condensate, at least in the way I have used it in the "PAQC" model (Sluyk & Nedelof, 1984). Condensate is ususally defined as hydrocarbon compounds with 5 to Carbon atoms (The Petroleum System Blogspot, 2015). Under some PVT conditions the condensates with the gas are in gaseous form in the subsurface, but then the gas mixture is produced the condesates become liquid by "raining out. If this already happens in the reservoir such liquids may hamper the dry gas production by blocking the pores. Condensate is different from the Natuals Gas Liquids ("NGL") with 2 to 4 C atoms, hence Ethane, Propane and Butane. In which form the generated HC are stored in the trap depends on the PVT situation and the richness and type of the condensate fraction. The condensate richness ("CGR")is normally reported as barrels per million standard cubic feet, or M3 liquid per million M3 gas, but also as M3/M3, or implicit in a Gas/Oil Ratio. It would be nice to know if a useful universally applicable relationship of CGR exists with depth, pressure, temperature, SR-type and maturity. A limited study of 73 condensate accumulations has provided a regression of CGR on pressure, that has some predictive value.
Back to entrapment
"Reservoir geology" is a part of geology that specializes on the various aspects of the geology. It combines tectonics, sedimentology, seismic interpretation, reservoir engineering, petrophysics and paleontology, depending on the type of reservoir and the subsurface situation.
A simplified scheme for reservoir description is as follows:
Reservoir
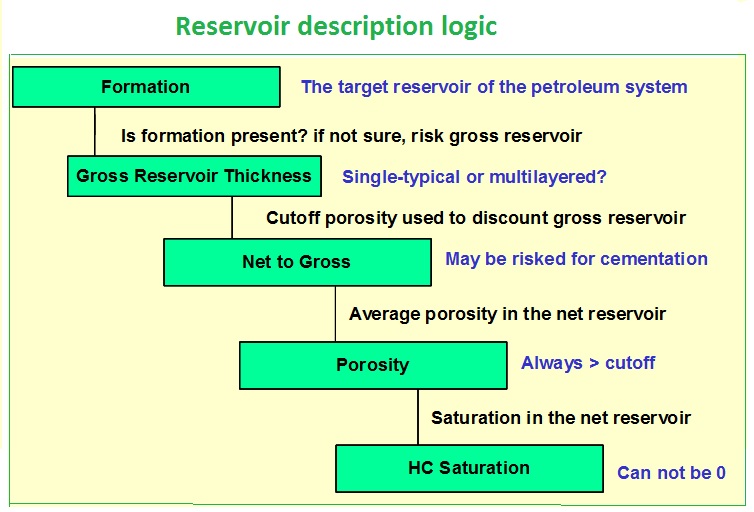
The important aspects of reservoir are:
- Lithology
- Porosity
- Permeability
- Continuity
- Thickness
- Net-to-gross ratio
- Oil/Gas saturation
In many appraisal systems the above items are described in isolation, giving ranges of values. It is important to realize the above logic scheme because the reservoir characteristics are not entirely independent. First, the formation may be seen as a rock unit that contains, but is not necessarily identical with gross reservoir. The gross reservoir has to be clearly defined. Having gross reservoir defined, the net reservoir is the part that eventually may produce. The envisaged oil or gas saturation (the complement of water saturation) is dependent on the permeability as well as porosity. If this is used as a starting point, there will be a cutoff porosity, below which the reservoir may contain HC, but is not producible. This cutoff should be the yardstick to determine the net reservoir within the gross reservoir, and hence the net-to-gross ratio. This means that one is not free to give any value for oil/gas saturation, as this pertains to the net reservoir and hence is always > zero, and probably some 50% at least. Equally the porosity is the cutoff % at minimum. Looking at all these aspects in isolation might well result in a "double discounting" bias in an appraisal.
Primary porosity can be very high in sands and carbonate grainstones when just deposited. And interesting studies have been made to track what eventally happens to it during compaction and diagenesis at depth. Porosity can be related to the temperature history, although SR maturation is not significantly dependent on pressure, but porosity is. The temperature history is related to the most common diagenetic processes, such as cementation. The relationship has been researched by Schmoker et al, 1982, 1988. Such trends of porosity with depth or maturity can be used to get a prior probability which can be updated with the local data, if available.
With regard to pressure, it is interesting to see how in one formation the porosity is significantly affected by the overburden pressure:
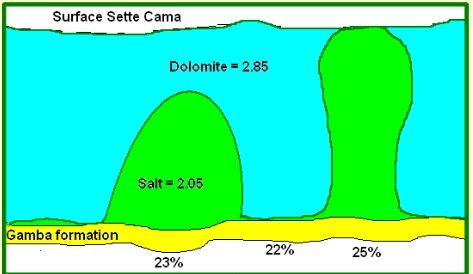
The thick package of dolomites, in between the saltdomes make for a large contrast in overburden (in particular: skeleton, or grain to grain) pressure. Hence we see several % less porosity in the Gamba reservoir than just below the light salt. Also lateral tectonic pressure will claim its toll as mentioned by Teixell, 2000 as crustal shortening is not only by thrusting, but also by lateral compaction of porous rocks.
In cases where reservoir formations are over pressured, the grain to grain pressure is less than in normal-pressured reservoir at the same depth, and porosity better preserved.
Permeability. For all reservoir rocks, porosity is not enough for qualifying as a valid reservoir for oil/gas production. Permeability has to be measured or estimated to make a judgment. For clastic reservoirs a log(permeability) versus porosity is a more or less linear relationship. From this one can estimate at which porosity the required minimum permeability is reached. This is the "cutoff" porosity, used to define what is "net reservoir".
The relationship between permeability and porosity has been studied from the theoretical point of view by Karmeny (1927) and Carman (1937) because the pore-thoat size is related to the grain size and porosity and led to the "classical" Kozeny-Carman equation. A recent theoretical investigation is given by Costa (2006).
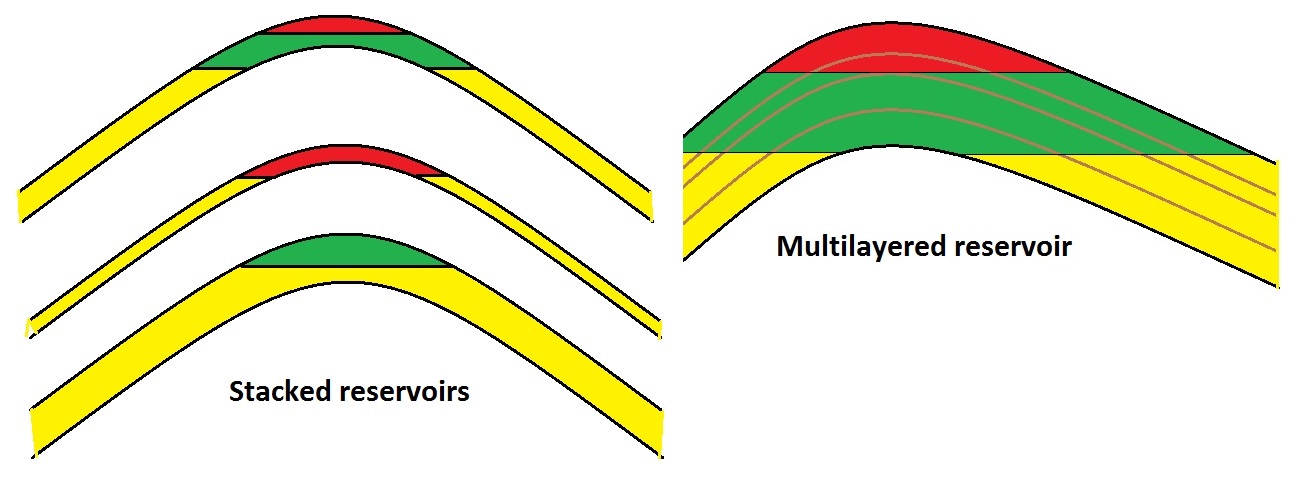
A practical aspect of reservoirs in prospect appraisal is the occurrence of a "multilayered" reservoir, which is here defined as consisting of several porous layers, separated by less porous non-reservoir beds. These non-reservoirs are non-sealing, hence an accumulation can have a water/HC contact right across the layers, i.e. the reservoir layers are in communication. The other possibility is that there are multiple reservoirs: "stacked" reservoirs that are not in communication, e.g. deltaic sequences. Each of the stacked reservoirs have its own HC/water contact, if any. In the entrapment modelling, a multilayered reservoir receives all the HC charge, in the other case the charge must be divided over the number of stacked reservoirs. If the charge comes vertically upward from below, it becomes difficult to imagine what happens: are the lowest reservoirs filled to spill point and then the next reservoir by leakage through the seal, or through fault conduits?
In a multilayered reservoir it may occur that there is a "waste zone" between the top of the real reservoir and the base of the seal. The waste zone will take up part of the HC charge, but is too poor a reservoir to produce. This is a serious disadvantage in quite a few cases.
Back to Reservoir
Retention is about keeping the accumalted HC in the trap and of good quality until we find them. Various factos form a risk to retention (Macgregor, 1996).
Retention
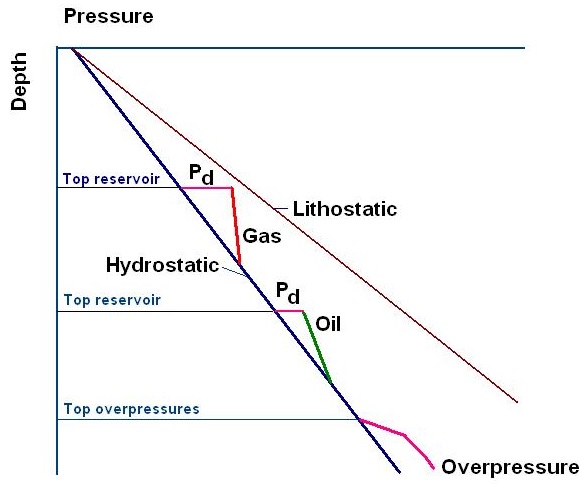
In an attempt to quantitatively estimate a Pd of a top seal, Mohler and I (Nederlof & Mohler, 1981) made an analysis of some 160 accumulations with simple, apparently unfaulted top seals. The differential pressure (Pd) was calculated from the HC column length and characteristics (oil and/or gas) and classified into one of the following situations:
- The minimum estimate of the Pd, which occurs if the HC charge is limited in relation to the trap, i.e. the seal might have contained a higher Pd.
- A real estimate, where the judgement was that the column lenght is just in equilibrium with the seal.
- A maximum estimate of the Pd where a column is apparently, but not certainly, in communication with a higher reservoir, separated by a (poor) seal.
For the seals the lithology, the thickiness, depth, estimate of the residence time of the HC in the trap was available. The a special regression program which takes censored values for the dependent variable (Pd) into account, was used to find relationships. The result was a significant correlation with thickness and depth. Still the most important factor remains lithology (capillary pressure proxy). The best lithology for a seal appears to be evaporite, especially halite. But even salt will sometimes fail as a seal (Petroleum Development Oman 2003?). The worst are obviously porous sand or carbonate.
The thickness effect can be explained as follows: (1) a thicker caprock is also likely to be more persistent over the whole closure. Also any fractures are less likely to form an effective network for leakage in a thick seal. (2) If diffusion could be causing loss, a thicker top seal will slow down diffusion.
Depth is an advantage, probably because more compacted (clastic) seals are better.
Residence time was negatively, but not significantly correlated with Pd. See also Zieglar (1992).
Estimating the length of an HC column using the differential pressure (δP).
If a well drills through an oil-filled reservoir we have an "Oil-Down-To" situation. If the spillpoint of the trap is much lower than the ODT, it would be nice if we can estimate how far further down the oil leg might go. The δP can be used to estimate the oil column down from the top of the reservoir as the pressure gradient (green) is less than the water gradient:
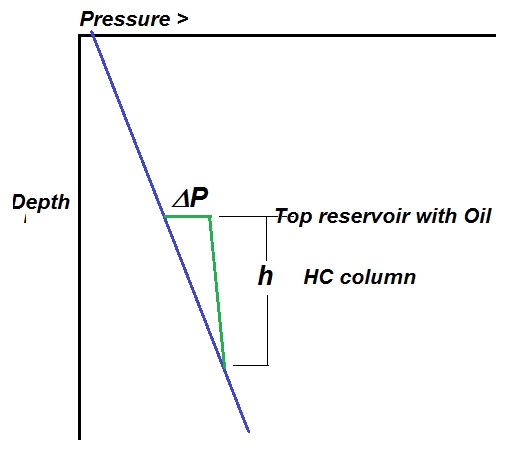

From which we solve h:

The various results of the above described top seal investigation are incorporated in my own GAEA50 software.
Lateral seal
Most lateral seal problems are encountered in fault traps. However in carbonate build-ups a lateral seal also has to be considered.
Fault seals are of various kinds: juxtaposition of a reservoir against an impervious formation, Clay smear in the less consolidated sediments and cataclastic sealing by the crushing of harder rocks. Of the many studies of fault seals the following may be helpful: Watts, 1987, Lehner & Pilaar, 1997, Yielding, et al. (1997), Freeman et al., 2010.
For juxtaposition Allan, (1989), Knipe et al. (1998) shows a juxtaposition diagram" as a helpful tool to see the possible traps in a sand/shale sequence. A simple but practical tool is also putting a well log of an "analog" well against itself, and shifting it to what happens at different throws. For more see or Yangwen Pei et al., 2015.
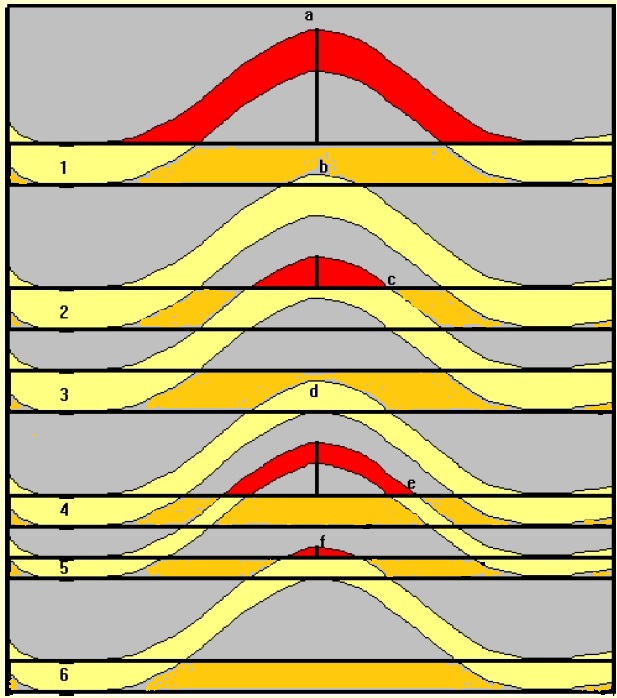
In the above hypothetical juxtaposition scheme, the black horizontal lines show the lithology of the footwall: gray mudstone and dark yellow sand. The hanging wall is superposed on this: alternation of light yellow sands and transparent seals. Layer 1 is lucky: the culmination is against seal in the opposite block at a. Layer 2 leaks at b. through the sand at the other side. This does not take into account the possible sealing effect of the faultplane itself by smear or grain crushing.
Various quantitative parameters have been developed to estimate seal capacity from clay smear, based on thickness of the different lithologies, throw, etc. An excellent overview of Clay Smear Potential (CSP) has been given in Koestler & Hunsdale, 2002, and shows that it is a useful tool.
Oils can be degraded in the subsurface if the reservoir temperature is roughly below 75 degrees C. The aerobic microbes have a favourate plate: n-alkanes, so the leftover gets heavier in the process of degradation and it may become unproducible. See Atlas, 1981 for a good overview. In the process of degradation, CO2 and CH4 can be produced. These two gasses have a distinct isotope composition. In Western Siberia large medium depth gas accumulations might in part have been formed by such degradation processes of oil accumulations that are now mainly residual heavy oil (Milkov, 2010).
Lafargue & Barker (1988) carried out experiments washing oil with water and concluded that some hydrocarbons are removed in the sequence aromatics, then n-alkanes, then naphthenes, but never leading to tar deposits. So the effects may obscure the oil/SR correlation, making oil a bit more heavy, but it is not very detrimental to the oil quality.
Thermal cracking of oil first generates gas and finally the remainder of the oil turns into pyrobitumen and finally into graphite (Barker, 1990). See also the section on non-hydrocarbon gas. Interesting is the increase of pressure, similar to what happens in a maturing SR. Smaller molecules derived from larger ones tend to take up more space and so increase the pressure. Depending on the situation fracturing may be caused when the overburden pressure is exceeded. Pyrobitumen in a reservoir once buried to som 7 Km depth has been shown by Pingping Li, et al., (2015) in thin sections.
Recovery of oil or gas in economic quantities is the realm of reservoir engineering. For prospect appraisal it may not be possible to have all the information to estimate the percentage of oil in place or gas that could be produced in the fields lifetime. The amount is anyhow subject to oil and gas prices, technology, presumed drainage area of wells, regulation, etc. For a geologist it may suffice to make a rough estimate on the basis of experience and will notably be "primary recovery efficiency".
What the geologist may estimate is lithology, porosity, permeability, API gravity of oil, depth/pressure of the reservoir, presence of condensate in gas, but rarely the drive mechanism. In a mature area with a fair number of fields, relationships between recovery and the mentioned variables may the help in narrowing the range of possibilities. If this cannot be done, it is useful to know what a world-wide sample of oil recovery efficiencies would be like. For gas the recovery efficiency is usually fairly high, in the range of 60 to 90%.
Apart from primary recovery, the oil left in the reservoir can be produced by secondary recovery or enhanced recoverywhich can involve water or gas injection to maintain reservoir pressure or more complex techniques. It matters considerably in the economic analysis what assumption is being made about the recovery. The primary recovery demands less capital and operating expenses than the more advanced recovery systems, hence choices are between expensive higher recovery, or cheaper lower recovery for the evaluation of net present value.
The recovery efficiencies discussed above are maily about reservoirs in which fractures are not very important and practically oil or gas is produced from the matrix porosity.
Fractured reservoirs have a matrix porosity and a fracture porosity. Aguilera (2003) distinguishes three conditions:
This is very difficult to do with any confidence and it has been employed in the very early beginning of prospect appraisal. One could imagine that only with the experience in a maturely explored province a meaningful estimate could be made on this subjective basis.
This system is aimed at estimating the total resouces still to be found in an area, but not for a particular prospect. It would require a good sample of already discovered fields and the success rate so far. The field size distribution is usually reasonably lognormal, aqlthough other distribution types have been used, such as the pareto. Then assuming that the future discoveries are similar to those found, an extrapolation over an estimated number of undrilled traps would give an expectation curve of undiscovered resource. In most provinces, however, one can not assume that the future will be the same as the past!
More advanced statistical methods, involving field size distributions were developed by Lee et al., 1983, 1985, 2008. and led to a computer program PETRIMES.
This idea, that in some cases is called "Creaming" has been developed by many researchers. For instance Meisner & Demirmen (1981) used bayesian statistics to estimate the future discovery resource in a province. Discovery history was originally studied by Arps & Roberts (1958) for the Denver-Julesberg basin. My own research in creaming involved the separation of the data in such a way that three graphs are produced:
Bacterial degradation
Water-washing
Cracking
Recovery
In an oil reservoir with an original gascap, the recovery may depend on the thickness of the oilrim.
Naturally fractured reservoirs
From this list it will be clear that a wide range of recovery efficiencies is possible: for oil 15 to 65 and for gas 10 to 90% of the in-place HC for the different types and drive mechanisms. If recovery is estimated, it is important to know what kind of porosity was estimated, and then, on the basis of the type of fractured reservoir to estimate the efficiency. For instance we might have a 1.5% fracture porosity and an ineffective matrix porosity. Then the recovery efficiency might be, say 80%, but over a very small volume of HC in-place.
Models
Prospect appraisal models are fall into three main categories:
Direct estimation of percentiles
Statistical extrapolation with a "stationnary" mean field size and success rate.
Extrapolation of exploration history, or Discovery Process models
The above system might be called "one-dimensional", as only time is the independent variable. More sophisticatyed system involve the locations of discovries and possible future drilling sites into account. Even a fourth variable, such as the depth of accumulations can contribute to estimation, making it a four-dimensional creaming.
For the one-dimensional analysis the data have to be carefully collected, so that it is , as much as possible, based on the Ultimate Recovery of field reserves. The most recent discovery sizes may be as yet be underestimated and hence cause a "false creaming", leading to a pessimistic estimate.
Stochastic models
These models involve more geological input then the statistical approaches. The most widely used in prospect appraisal is a Petroleum System model that:
- Estimate the probability of success (finding at least some oil/gas).
The probability of success is taken to be the product of individual probabilities of fulfillment of a number of factors, such as generation, migration, entrapment, retention and recovery. The factors are independent, therefore the system is in a statistical sense "orthogonal". - If an accumulation is found, what is the size distribution.
The possible volume of recoverable oil/gas are subjectively estimated with the usual factors, such as reservoir thickness, net-to-gross, porosity, oil saturation, PVT situation, recovery efficiency. Each of these factors is input as a distribution, e.g. lognormal, triangular, normal, etc. A Monte Carlo analysis is then performed, taking dependencies between some of these factors into account. The result is a distribution of the possible "unrisked" volume.
Material Balance models
The principle of such models is a simulation of all the processes of the petroleum system. The main two parts are the hydrocarbon charge and the trap capacity. These two volumes have to be "balanced". The following figure shows this schematically, showing the different possibilities for the entrapped HC. If there is too much charge, "spill" will migrate updip, or leak in case of insufficient seal. A leak can also be lateral, in addition to top seal leakage.
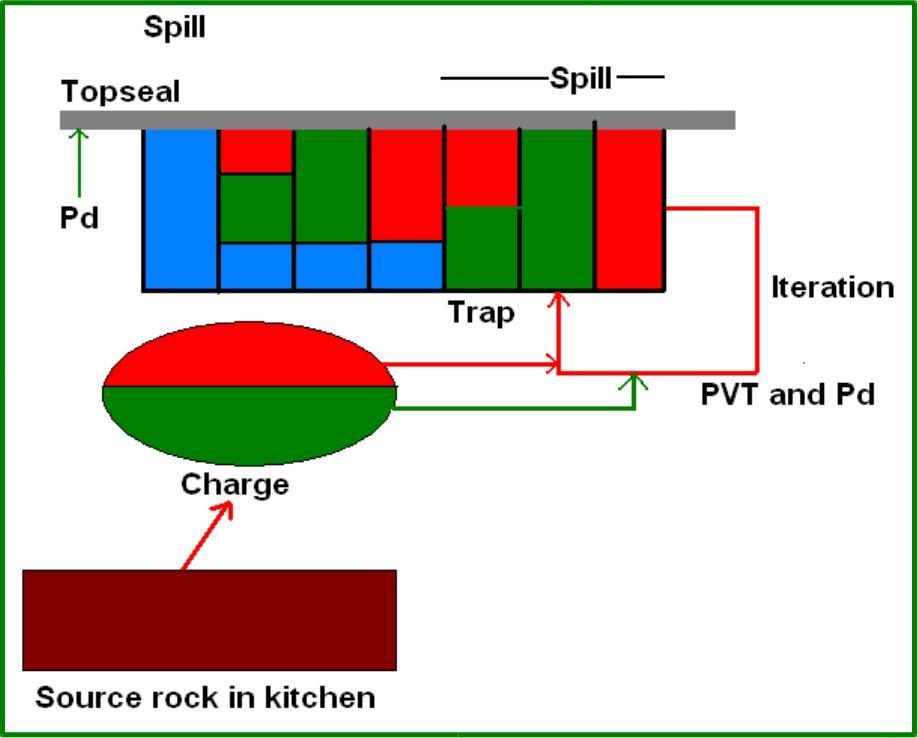
The input variable values are entered as distributions. In Gaeapas there is a provision for at least some variables, to use a bayesian method of estimating the uncertainty of variables, in other models there is just subjective estimation. The probabilities of success are estimated usually for each variable, like in the other models described above. However in Gaeapas, the HC charge probability is estimated in a bayesian way, using world-wide experience, in an effort to reduce the subjectivity (Sluyk & Nederlof, 1984). The models can best be ran using Monte Carlo to deal with the complex uncertainties.
Uncertainty analysis
The above models create estimates that include an attempt to quantify the ucertainty of the results. This will never be complete, as there are two sources of uncertainty: the aleatoric and the epistemic. The variance of a model result is simply speaking, the sum of the input variance and the model variance.
The aleatoric uncertainty is a stochastic uncertainty, because the input variables are not exactly measured. In a prospect appraisal it is the input variance.
The epistemic uncertainty is due to the imperfection in mimicking reality with the model. This is reflected, in a calibrated model as the standard error of estimate of the regression. Even this does not reflect the total uncertainty, which manifests itself when the model is applied in the real world. One possible reason is that we should have included other variables, or that we extrapolate regressions beyond the ranges in the calibration set. An example is given in the explanation of hindsight analysis, which provides realistic insight into the total variance. The fundamental imperfections of modeling are related to the luddic fallacy" as described by N.N.Taleb (2007) in his book "black swan".
Back to ModelsDate: 11-03-2017
