Helpfile for POSMSV
Introduction
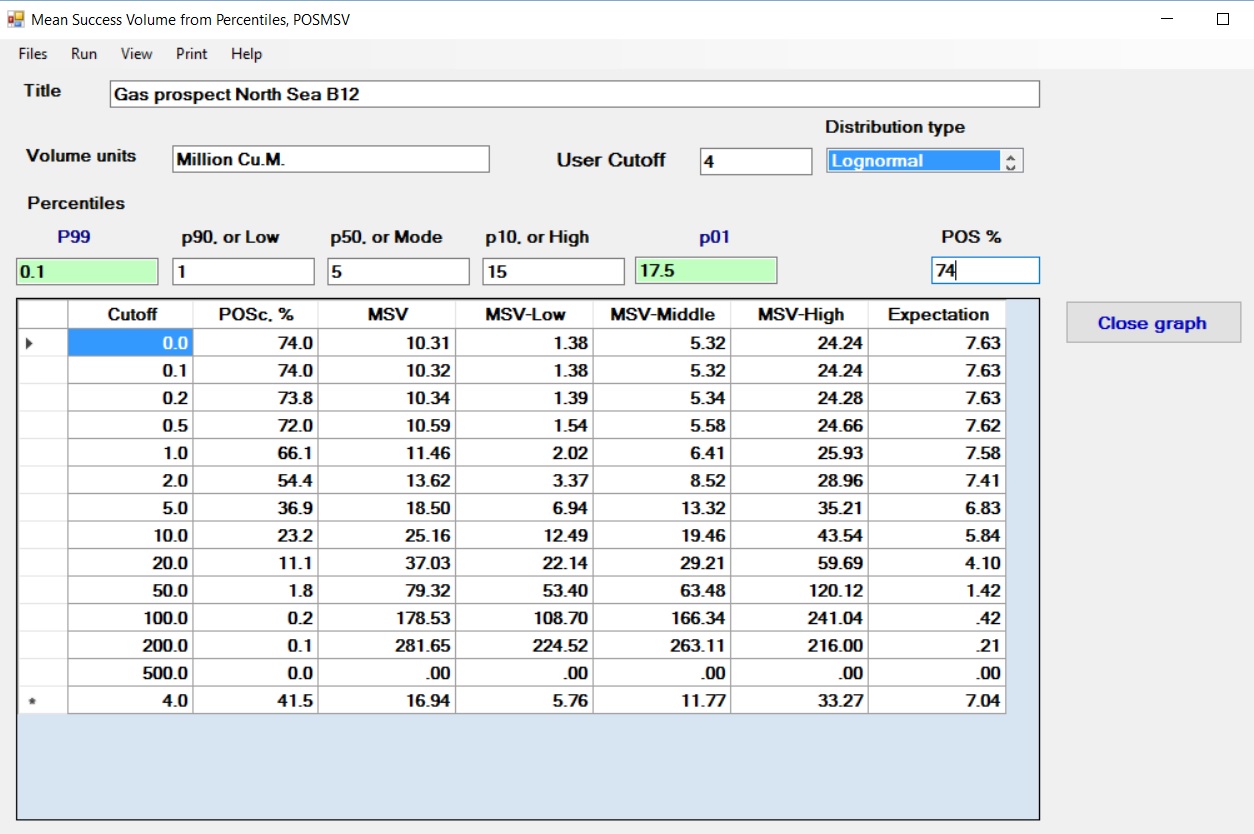
The POSMSV program produces a table of unrisked volumes (MSVc), probabilities of success (POSc) as well as expectations, as a function of a cutoff. For economic analysis, the P90, P50 and P10 numbers for the reserve estimate may give a misleading economic evaluation if an economic minimum volume for development is not taken into account. This table allows to evaluate a prospect at different standard cutoffs, and the user may specifically ask for a cutoff, which may not occur in the standard list.
Input
- Normal distribution. Use at least the P90, P50 and P10. For more accuracy use the P99 and P01 as well, if available.
The optional P99 and P01 input boxes are marked green. The program estimates the mean and standard deviation from these inputs.
- Lognormal distribution. Same input requirements as for the Normal.
- Triangular distribution. Here only three parameters are required: the Low, Mode and High. The mode is the "most likely value", not the mean, but occasionally coincides with the mean if the distribution is symmetrical.
- Rectangular distribution. Only the Low and the High parameter are required.
- Constant. An unlikely choice, but included for completeness. Put the same constant value in the Low, Mode and High boxes.
The "Geological Probability Of Success"or "POSg, %" is provided by the user in the upper right corner POS input box.
As the standard list of cutoffs may not include the user choice, the cutoff box allows to enter a "Usercutoff", the result of which is shown in the last line of te result table.
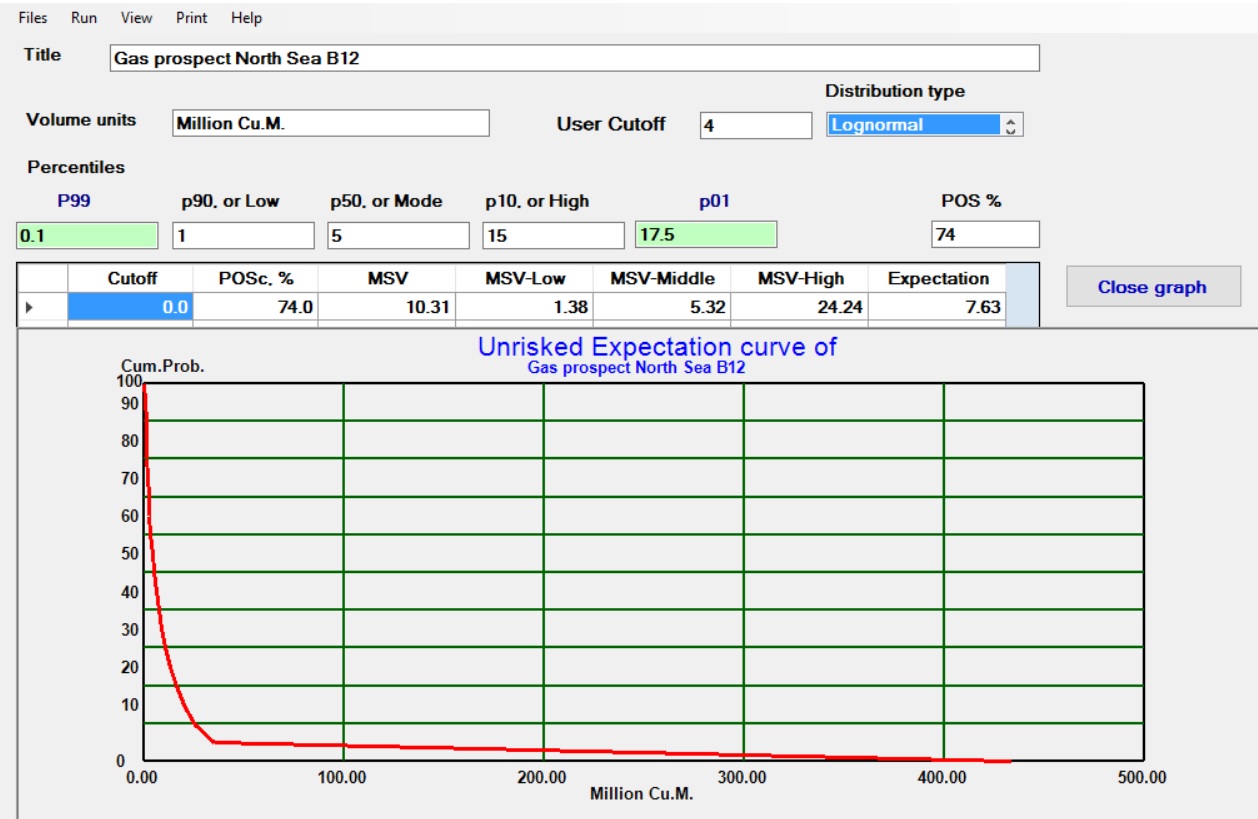
The meaning of the various parameters used here is explained in the following figure of an expectation curve:
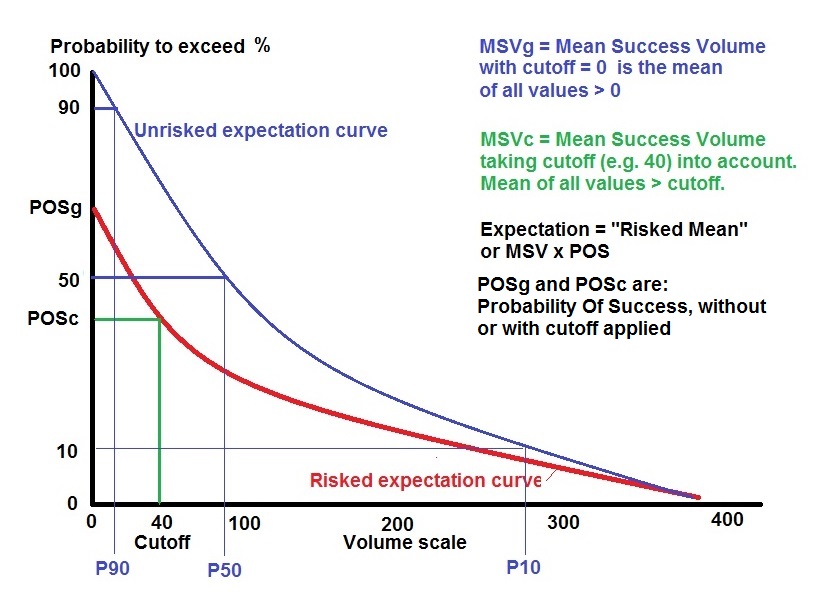
The blue expectation curve is the important one for the economic evaluation. Although it is not often shown, the following three important parameters are usually given in reports: The percentiles P10, P50 and P90. If available also the mean is provided. If we would make economic evaluations for the three volumes (P90, P50 and P10) and take the mean PVNCS of these, it would be a somewhat pessimistic evaluation. The reason is that all possible outcomes to the right of the P10 would not be included. And these are just the "bonanza" cases! This is one of the main reasons to use the success volume, or even better the Low, Middle and High Successs Volumes for an economic evaluation. Then one can take the mean of the latter three evaluations, noting that each of these has POSc/3.
Output
The output is a list of 12 standard size cutoff volumes plus a last line in the table, showing the user choice of cutoff. When the cutoff has been applied the parameter have the character "c" attached to the name, to distinguish these from their geological counterparts (with cutoff zero). For each row of the tabel the following parameters are given:- Cutoff
- POSc, the probability of Success after cutoff. This will be smaller, or equal to the input POSg
- MSVc
- MSVc Low, associated with one third of the POSc
- MSVc Middle, associated with one third of the POSc
- MSVc High, associated with one third of the POSc
- Expectation after cutoff