Subjective estimation and appraisal
To answer the question "Is this a good or bad prospect" one could answer in terms of quality, such as "fair" or in quantitative terms, such as providing an expectation curve, a quantitative statement. The same distinction can be made when the question is "How do you rate the chance of success?". Terms as "very likely", "probable", "unlikely" and many others are used to give a subjective, intuitive estimate of a probability. The alternative is to assemble data and count frequencies of previous events, or some more sophisticated statistical method to come to a probability as a number between 0 and 1. Also numbers have to be estimated when only scanty information is available. The following discusses:
- Relationship between common terms expressing probability and numerical probability.
- Ability of subjects to estimate numbers and proportions as well as confidence limits.
- Amount of information and Probability of Success.
If we want to have prospect appraisal results, (volumes and chances) in a form suitable as input in, say a Monte Carlo economic analysis program, numbers are more suitable than words. Many psychlogists have done research to see how the human mind estimates a probability. Experimenting with groups of persons, a correlation could be made between a list of probability terms and their numeric equivalents, as shown below.
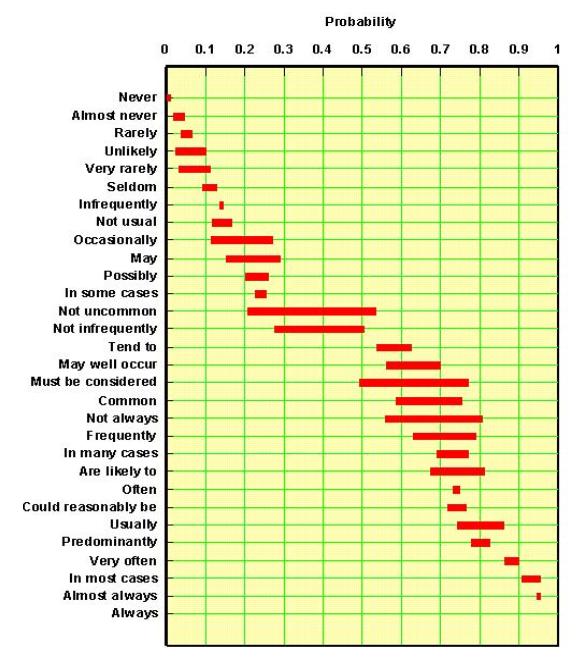
From this and many other similar experiments it is clear that such subjective terms can be translated meaningfully into numerical probabilities, although not with much precision. Not surprisingly, the "double negation" statements as "not uncommon" are the vaguest of the lot. It is intriguing to see that no clear statement is available for the 50% probability. However a "likely" chance, or a "fifty/fifty" chance is a common term for such a situation. In my experience, it is best to have a set of predefined terms, such as likely, very likely, certain and impossible, arranged in a scale of increasing confidence A.Coffinier ( Shell, 1975, who devised this scale) suggested that weights could be assigned that increase with a factor 2 along this scale, except for the extreme ends. That would look like this:
| Degree of Confidence | Weight factor |
|---|---|
| Impossible | 0 |
| Extremely unlikely | 1 |
| Very unlikely | 2 |
| Unlikely | 4 |
| Likely | 8 |
| Very likely | 16 |
| Extremely likely | 32 |
| Certain | Infinite |
An experiments with 30 subjects allowed to estimate the relative likelihoods of successive steps in this scale of degrees of confidence". Interestingly, subjects would switch to the next higher term, or the next lower, when the (true) likelihood changed with a factor 2. This result is consistent with biological research on stimuli, where, for instance, increased pressure on the skin will trigger a response only when the pressure is doubled, and therefore appears to justify the above weights.
Rather than making a single point estimate, a geologist may use this scale to express his uncertainty about a value. Now this value may be itself a probability, for instance "What is the chance of having a sourcerock?", or the value may be a numeric value of a variable, such as "What is the average porosity of the reservoir?".
The mechanics of using this scheme is to calculate the expectation from the scores assigned to the 8 classes, using these weights. In the case of a probability we would end up with a single estimate of the probability, but one which should better represent a subject's thinking than asking immediately for this single number. Note that the mechanism should return zero if there is any score assigned to Impossible, or 1, if any score for Certain. These extremes would simply override any intermediate statements. In practice, the above scheme does not deviate significantly from one in which we let a geologist start from a numeric scheme of estimating a histogram. First the histogram classes are fixed. For a probability one could use 10 classes of width 0.1. The the user should assign scores subjectively to these classes. Their scores would be the weights to be assigned to the class-midpoint.
Subjective estimation of numbers, proportions and confidence limits
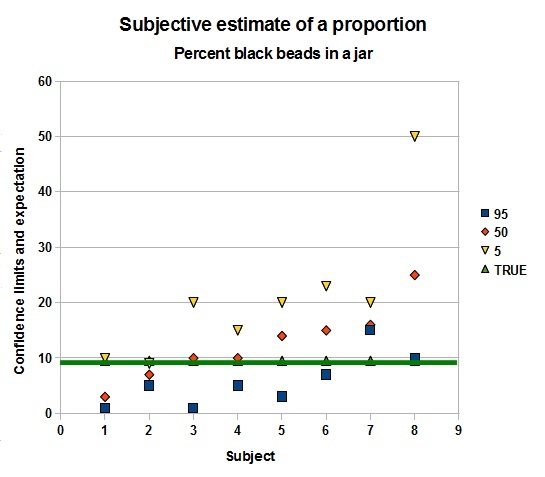
An experiment with a jar of white and black beads gave the following result. Artificial uncertainty was generated by showing the jar only a few seconds. Then the 8 subjects had to estimate the number of beads in the jar and the proportion of black beads. Also confidence limits had to be guessed. Not a very scientific experiment, but still quite revealing.
 |
|
Apparently, it is a bit easier to estimate a proportion than a number, as the deviations from the true number of beads are more pronounced than for the percentage black beads. But both experiments show that at least a fair number of people are too confident about their estimate. In three out of eight cases the true value lies outside their 1 - 99 % range!
Interesting is that the mean estimate for the number of beads is 275, very close to the true value, but the individual estimates vary from 120 to 450. That the mean is so close would suggest that a compromise number decided upon in a Delphi exercise might well be preferable, than just trusting one individual. The proportoin is overestimated by this group: 12,5 instead of 9.5, buthat is not a very serious deviation. For the proportion there are two subjects who completely miss the true value in their confidence range.
In another experiment I asked subjects to estimate relatively small chances:
- Throwing four dice - what is the probability that the sum of faces exceeds 20? The sum is distributed approximately normally. The answer should be 2.7%. The average of 8 answers was 9.5%, or 3.5 times overestimated.
- Throwing four dice - what is the probability thet the product of faces exeeds 1000? The answer shoud be 0.39%. The product is approximately lognormally distributed. The average of the answers was 2%, not bad, but still 5 times overestimated.
Clearly, subjective estimation of probabilities and numbers are weaker the less information is available, so it helps to a certain extent, to make estimates in a team, while confidence limits estimates can then also be improved upon.
I have met several evaluation systems which, in some way or another confuse amount of information with probability. In those cases a subjective probability is thought to be dependent on the information. This is not the case. The amount of information influences our confidence in the probability estimate, not its value. Uncertainty (or if you wish variance) of the probability guess is dependent on the quantity and quality of information available. An illustration of this principle is discussed in the description of the Beta distribution.
If additional, or better quality information becomes available, it can be simply confirmative and hence give more confidence in the earlier estimated probability, but, in principle, it does not increase the probability. If the new information is
different from the earlier data available in the sense of more favourable or less favourable, then also a new probability etimate has to be made. Conclusion: we may not assume beforehand that more information will increase the probability or the opposite.
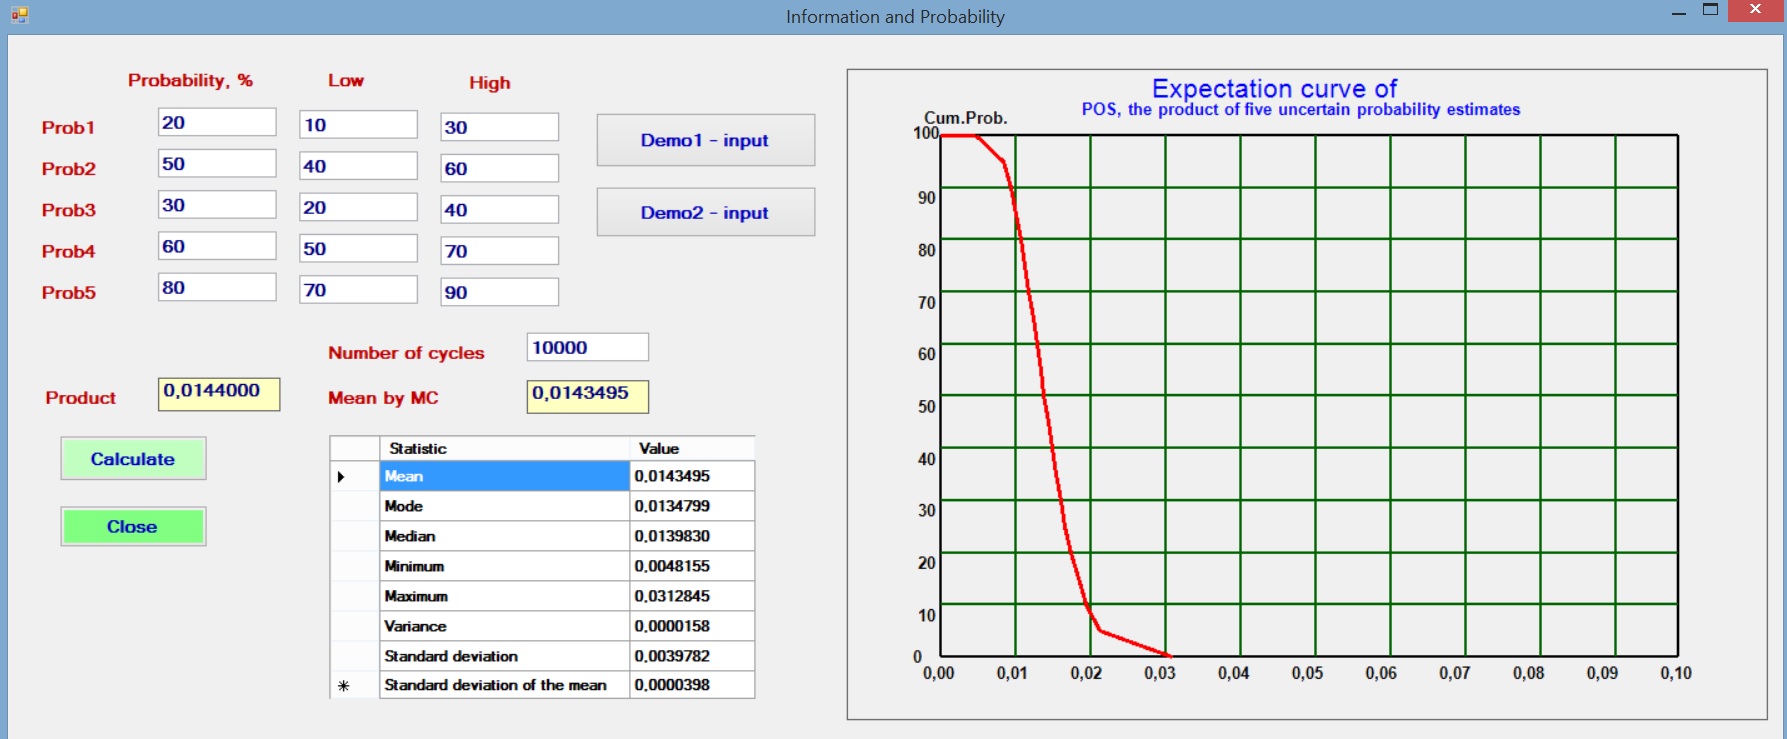
In the common case that a number of probabilities are estimated and multiplied to give an overall probability, it is interesting to see what happens if we assume a small uncertainty of the individual probabilities. To model this situation we assume that the initial probability, say Prob1 is the best estimate, or mode of a triangular distribution. The estimator also gives a Low and a High estimate to reflect his uncertainty about Prob1 and likewise for the other probabilities. Then a Monte Carlo analysis with 10,000 cycles draws from these distributions the individual probabilities and multiplies these to obtain the POS for each set of random draws of the Probs.
The results with various sets of individual probabilities shows that the resultant product (POS) is not dependent on the uncertainty (the range given by the triangular distribution). One of the trials is illustrated below. The POS as the product of the best etimates is practically the same as the mean by the Monte Carlo analysis, which mimics the situation with less information.
Amount of information and Probability of Success