"Real knowledge is to know the extent of one's ignorance."
Confucius (551 BC - 479 BC)
Uncertainty
Uncertainty is the condition that prospect appraisers have to live with. Exploration has many aspects in common with gambling, despite all the science and technology applied. So, doubts about variables and results will always remain. As Voltaire expressed it in 1776: "Doubt is an unagreeable position, but certainty is an absurd one". What are the types of uncertainty that arise in prospect appraisal? In engineering uncertainty is classified as "aleatoric" if the modeler can reduce the uncertainty by gathering more data, for instance. Uncertainty is seen as "epistemic" if there is little one can do about it, unless having a more sophisticated model, if at all possible (Kerghian, 2007). In the following we will use porosity estimates as the prime example to illustrate the logic.
Uncertainty in the context of prospect appraisal is our lack of knowledge of the exact values that we can not measure, i.e. that we have to guess. Therefore uncertainty is often expressed as a variance, a way to quantify uncertainty. When looking at an appraisal model we may distinguish different types of variance. Proper understanding of the differences and methods to attempt to reduce these variances is important. The different categories are:
Variable variance (akin to aleatoric uncertainty)
The parameters involved in an appraisal model have to be estimated. The estimation is almost always dependent on a subjective interpretation of limited information. For instance the estimate of porosity in the prospect may be based on a number of analogons, nearby known accumulations where measurements are available. In that case it is important to realize that the estimate is about mean values of those fields. The actual data at hand are likely to be individual porosity values in samples. For our target prospect we want a mean and a standard deviation of this mean of the porosity. The sample means and the variances of porosities in the analogons are the basis of the estimation. A "pooled mean" of the analogon porosity data is calculated (which is the same as the mean porosity when all the data from the analogons are taken together as one sample). In addition the "pooled variance" of the same data. The pooled variance "sp2" calculation is somewhat different and given by"
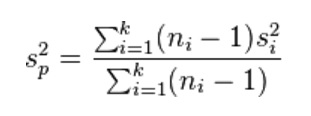
where ni is the sample size of analogon i and k the number of analogons. si2 is the unbiased sample variance of sample i.
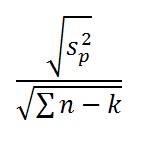
The above assumes that the variance of porosity values is the same in all analogons and in the target prospect. The standard deviation of the (target prospect) mean is now calculated as:
The above could then be a basis for a porosity input statement.
Here is an example calculation:
| Analogon1 | Analogon2 | Analogon3 | Statistic |
|---|---|---|---|
| 12 | 7 | 12 | Data |
| 10 | 6 | 9 | Data |
| 5 | 10 | 9 | Data |
| 13 | 8 | Data | |
| 11 | Data | ||
| 5 | 4 | 3 | Sample size |
| 51 | 31 | 30 | Sum |
| 10.200 | 7.750 | 10.000 | Mean |
| 9.700 | 2.917 | 3.000 | Variance |
From the table above"
The pooled variance is 5.95
The total number of porosities is Sum(ni) = 12
The number of analogons (groups) is k = 3
The mean is 9.33
The standard deviation of the mean is the Square root of (5.95/(12-3)) = 0.813
Variance of means
Although we cannot observe a variable within our target prospect, we can imagine that porosity varies over our prospect. However, this plays no direct part in our estimates, as the multiplication of the prospect variables, in the simple case of a resource estimate is based on multiplying means over an accumulation. The variance of a mean value is the variance of the individual data divided by the samplesize, and, in terms of the standard deviation, the standard deviation of the data divided by the square root of the sample size. In the target prospect such data are not available. If analogons with a similar petroleum system are present, the above statistical approach could be used.
Another situation arises if there are no suitable analogons in the neighbourhood of the target prospect. Then a subjective judgment has to be made simply based on experience, but a better idea is to use the various world-wide studies that have been made to establish correlation between porosity and depth or with the time-temperature integral (maturity}, see Schmoker et al. (1982, 1988). As most of these show point measurements of porosity versus depth, etc. it should be realized hat we wish to have the mean and its standard deviation, so the spread we use in our input will be less than what is shown in the graphs. A difficulty is to guess which sample size to use for estimating the standard deviation of the mean (say, at a given depth from a porosity/depth graph). However, the most logical estimate is obtained by regressing porosity on depth and using the standard deviation of the residuals at the desired depth and dividing this by the square root of the degrees of freedom. In cases without nearby data we can look for world-wide priors, a bayesian approach.
Model variance (akin to epistemic uncertainty)
A prospect appraisal model is just one possibility of representing reality. We may hope that our understanding of the petroleum system is such that we have confidence in the numbers that the model produces. The uncertainty expressed by hese numbers in the form of e.g. an expectation curve has two origins. One we know best, as it represents the uncertainty in the input variables (Input variance). The second source is difficult to assess, as it is the error of the model itself. The model error may lie in a variable that has been left out of the equations, or a fundamental flaw in the physics/chemistry assumptions. In the case of a system that was calibrated by a well researched learning set of analogons, the model variance can be quantified to a certain extent, the so-called calibration noise resulting from a regression analysis. The residuals from such regression are an indication of the proportion of model noise, basically 1 minus R-square. Here again we have a summation of variances when we use a model: Input variance + Model variance.
Appraisal models usually ask for an estimate of the Probability of success directly, or the model calculation produces this estimate. Uncertainty of the output expectation curve is caused by the POS as well as by the uncertainty about the size of the success cases. The contribution to the total uncertainty (variance) of POS is a non-trivial matter and is explained in the page on POS.
Conceptual variance
Assume that we are able to guesstimate the input values perfectly and that our appraisal model is also perfect. Even then there is uncertainty, because we have defined a prospect concept. For instance we have decided that there is a sand pinch out, capped by evaporates as a seal, sourced by an upper Jurassic formation. Possibly we have mis-interpreted the geological and seismic information. This source of uncertainty is often not likely to be recognized before drilling. In other cases it can be mitigated by appraising two or more alternative conceptual prospect ideas for the same target prospect. In the latter case the results of the different asssessments can be merged, given subjective degrees of belief of the various alternatives. The final result is then a weighted "mix" of two probabilistic assessments.